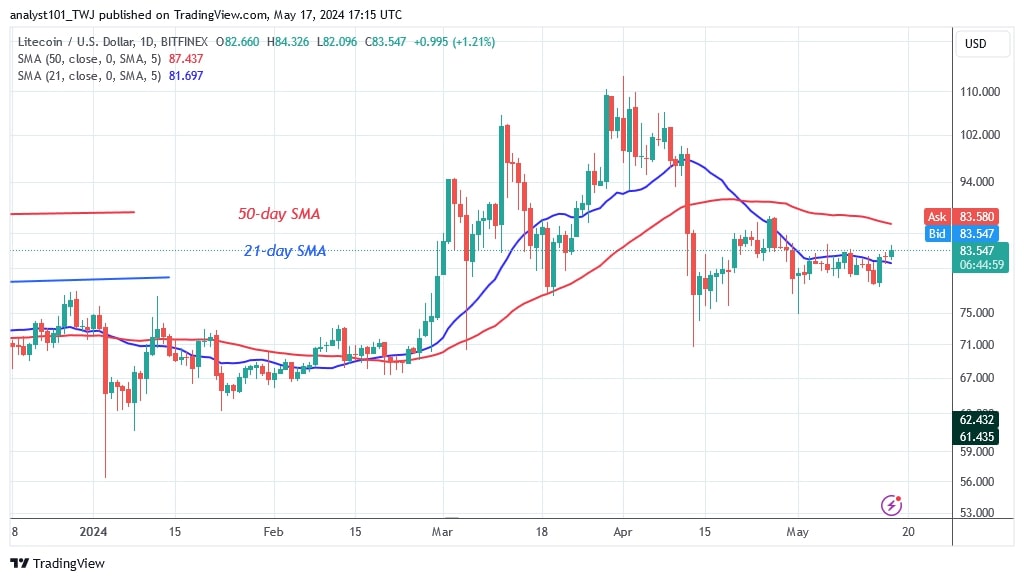
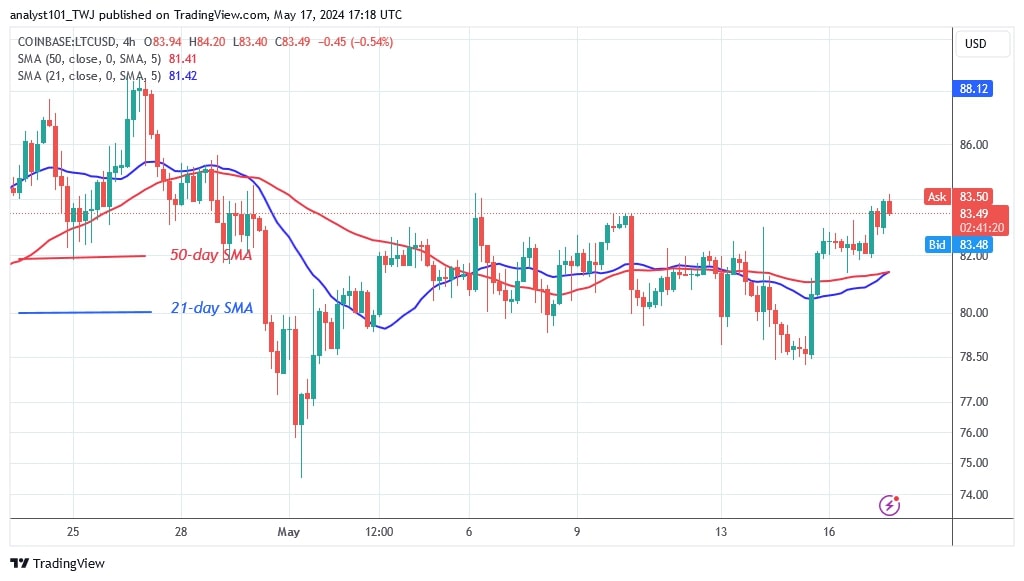
The price of Litecoin (LTC) has been in a sideways trend since the price plunge on April 13. The cryptocurrency is trading in a range between the support at $73 and the 21-day SMA or resistance at $84. Litecoin price analysis in May 2024 by Coinidol.com.
Long-term prediction of the Litecoin price: ranging
On May 15, the price of the cryptocurrency rose above the 21-day SMA. The altcoin is rising and is expected to reach a high at the 50-day SMA.
If buyers push the price above the 50-day SMA, the altcoin will resume its positive trend. Prices will rise to highs between $100 and $110 if the bullish momentum continues. The bullish scenario will be invalidated if Litecoin is trapped between the moving average lines. The cryptocurrency will fluctuate between the moving average lines in the coming days. The altcoin is trading at $83 at the time of writing.
Litecoin indicator analysis
After the recent breakout, LTC is now trading between the moving average lines. The altcoin is set to rise above the 50-day SMA, which will propel it into the positive trend zone. If the price bars are above the moving average lines, the altcoin will continue to rise.
Technical indicators
Resistance levels: $100, $120, $140
Support levels: $60, $40, $20

What’s the next move for Litecoin
Litecoin is currently moving in a trading range but trending upwards towards the 50-day SMA or resistance at $87. Litecoin will be forced to oscillate between the moving average lines where it will be rejected at the 50-day SMA. However, if the altcoin breaks above the 50-day SMA, it will resume its uptrend.

Disclaimer. This analysis and forecast are the personal opinions of the author and are not a recommendation to buy or sell cryptocurrency and should not be viewed as an endorsement by CoinIdol.com. Readers should do their research before investing in funds.


