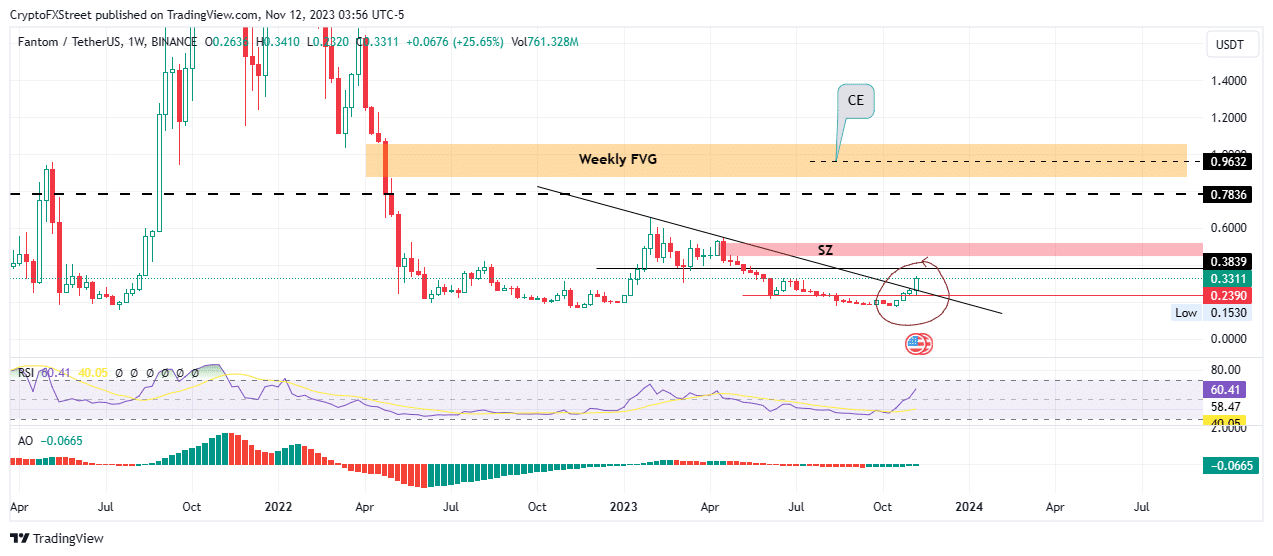
- Fantom price has broken a weekly trend, rising to auction for $0.3311 at the time of writing.
- FTM could extend the gains 35% over the next few weeks before confronting the supply barrier extending from $0.4449 to $0.5262.
- A weekly break and close below $0.2390 would invalidate the bullish thesis, putting the $0.1530 range low on the table.
Fantom (FTM) price is trading with a bullish bias in the weekly timeframe, with a sustained series of higher highs as the broader market rallies. More gains could be in the cards for the cryptocurrency over the coming weeks as chatter about the binging of a bull market continue to brew.
Also Read: Top 3 Price Prediction Bitcoin, Ethereum, Ripple: BTC rages on, $40,000 may not be hopium after all
Fantom price could rise 35% over the next few weeks
Fantom (FTM) price could have more gains incoming on the higher timeframe after breaking the weekly trend. Using the $0.2390 support level as the jumping off point, the altcoin could break past the $0.3839 resistance level, steered by increased buying pressure, to test the supply zone, 35% above current levels.
The supply zone extends from $0.4449 to $0.5262, marking a region where FTM expects massive selling pressure on the weekly timeframe. Here, Fantom price could either stall or reverse, as sellers are concentrated within the order block.
For confirmation of the primary trend (uptrend as seen in the weekly chart), however, Fantom price must break and close above the midline (mean threshold) of the supply zone, at $0.4859. In a highly bullish case, the gains could extrapolate for FTM to tag the $0.7836 resistance level, rendering the supply zone a bullish breaker.
In highly ambitious cases, the gains could increase for Fantom price, rising past the aforementioned supplier congestion levels to test the Fair value Gap (FVG) stretching from $0.8694 to $1.0605.
This FVG is significant for FTM, indicating a sort of magnetic pull for Fantom price as it represents an inefficiency or imbalance that needs to be filled. Once the price tags this order block, it could either reverse after filling the orders or continue north. For the latter to take place, Fantom price must break and close above the midline (consequential encroachment) of the FVG at $0.9632 on the weekly timeframe.
The Relative Strength Index (RSI) holding above 50 is a good sign, pointing to a strong price strength. Also, that it is below the 70 level means there is still room to the north before we can start talking about the risks of an overbought asset.
The Awesome Oscillator also supports the bullish outlook for Fantom price, showing a sustained streak of green histogram bars, evidence of bulls dominating the FTM market. These indicators add credence to the bullish thesis after the breakout.
FTM/USDT 1-week chart
Conversely, selling pressure from the supply zone and the $0.3839 supplier congesting level could cause a correction in Fantom prices, sending it down below the weekly trendline. A break and close below the $0.2390 on the weekly chart would invalidate the bullish thesis, bringing the $0.1530 range low into focus.


