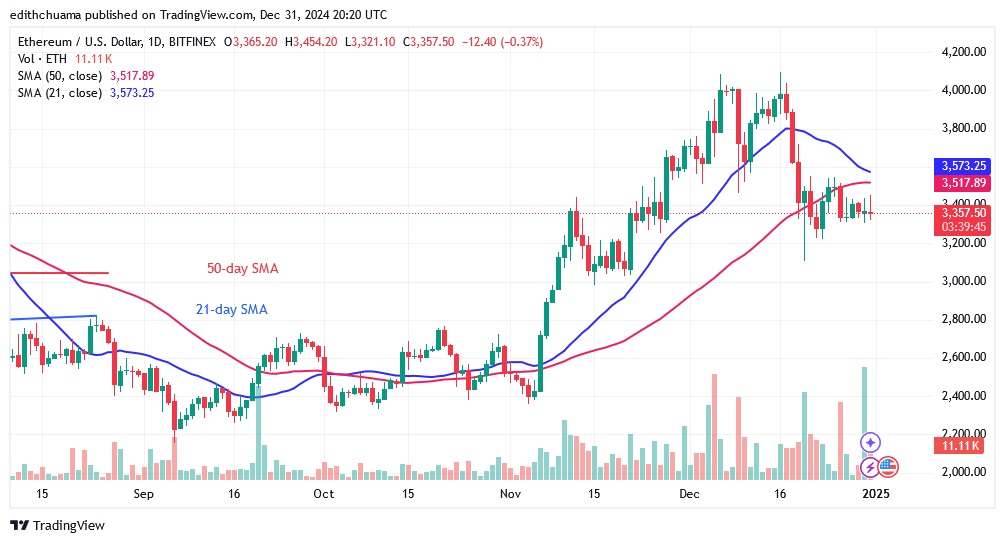
The price of Ethereum (ETH) has held above the $3,200 support level but below the moving average lines. Cryptocurrency price analysis brought by Coinidol.com.
Ethereum price long-term analysis: bearish
Neither the bulls nor the bears have cracked the range lines as the altcoin continues to fluctuate. In the downtrend zone, the bears have the advantage over the bulls as Ether declines. On the downside, Ether will fall to its current support of $3,000. Nonetheless, the bearish momentum will continue to the low of $2,850. The largest altcoin will start its uptrend if buyers sustain the price above the 21-day SMA. However, the upside is hindered by the moving average lines and the initial barrier at $3,400.
Ethereum indicator analysis
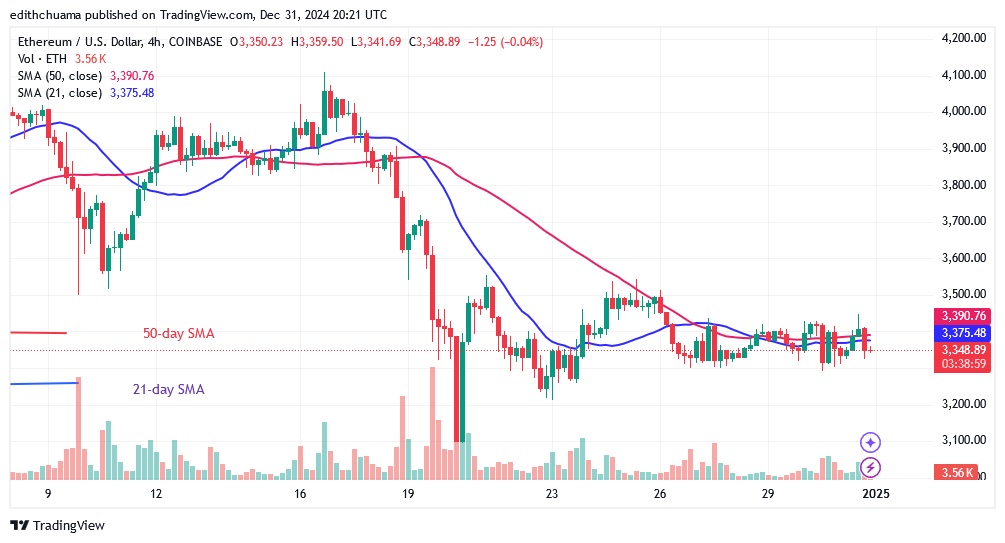
The price bars are below the downward sloping moving average lines. The 21-day SMA is sloping downwards and is about to fall below the 50-day SMA support. A break below the 50-day SMA support is a bearish signal for the cryptocurrency. On the 4-hour chart, Ether price bars are moving below and above the horizontal moving average lines, indicating a sideways movement.

Technical indicators:
Key Resistance Levels – $4,000 and $4,500
Key Support Levels – $3.500 and $3,000
What is the next direction for Ethereum?
On the 4-hour chart,the Ether price is stagnating due to the Doji candlesticks. On December 31, the bearish momentum broke below the moving average lines and continued to consolidate above the $3,200 support. Ethereum is now in a narrow trading range between $3,200 and $3,400. The price action is stalling above the $3,300 support.

Disclaimer. This analysis and forecast are the personal opinions of the author. They are not a recommendation to buy or sell cryptocurrency and should not be viewed as an endorsement by CoinIdol.com. Readers should do their research before investing in funds.


