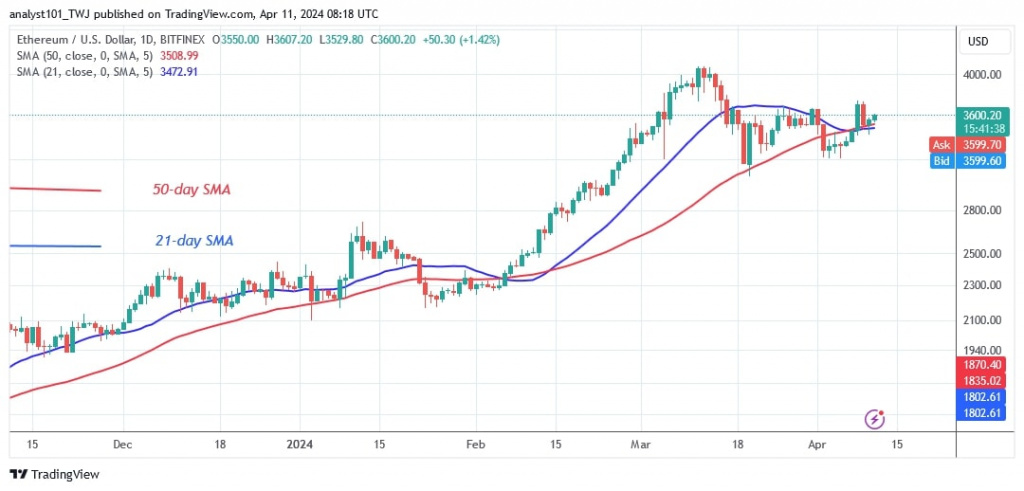
Ethereum (ETH) has returned above the 21-day SMA, suggesting that buyers are planning to take the altcoin back to its previous highs. Price analysis by Coinidol.com.
Long-term analysis of the Ethereum price: bullish
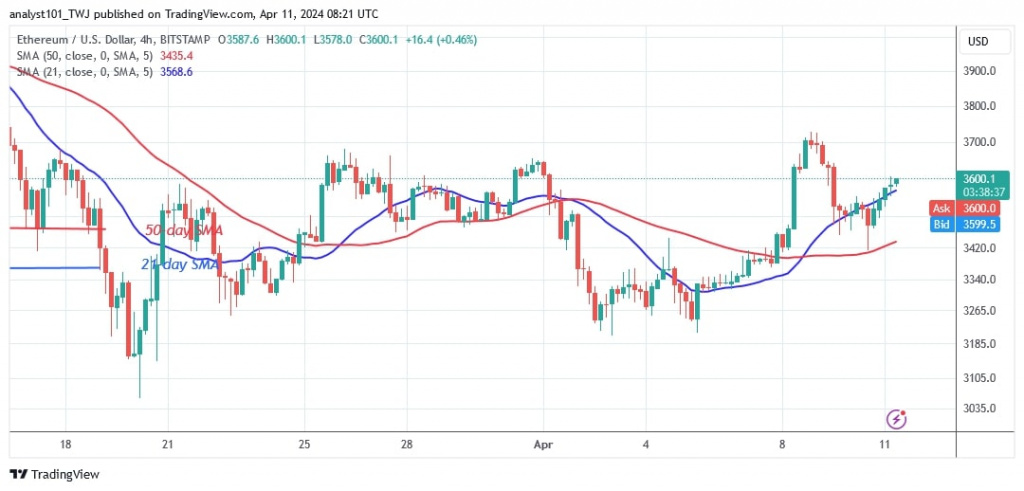
On April 8, 2024, the largest altcoin returned above the 21-day SMA, but the uptrend was halted at $3,700. The $3,700 barrier zone has slowed the upward momentum since March 17. This resistance level can be broken by the bulls if the altcoin rallies. Ether will rise to its previous high of $4,000 if buyers can break through the resistance and maintain their positive momentum above $3,700.
On the other hand, if the bears break below the moving average lines, Ether could fall. The cryptocurrency would fall to its previous low of $3,063. Ether is currently valued at $3,620.50.
Analysis of the Ethereum indicator
Ether is regaining positive momentum as the price rises above the moving average lines. The altcoin will continue to rise as long as the price bars are above the moving average lines. On the 4-hour chart, doji candlesticks limit the price movement of the cryptocurrency. Doji candlesticks indicate trader activity.
Technical indicators:
Key resistance levels – $4,000 and $4,500
Key support levels – $3,500 and $3,000
What is the next direction for Ethereum?
Ethereum has recovered above the moving average lines. The price of the cryptocurrency will rise if buyers defend the 21-day SMA support. Currently, the largest altcoin is trading between $3,100 and $3,700. Ether will perform if the current resistance and support levels are broken.

Disclaimer. This analysis and forecast are the personal opinions of the author and are not a recommendation to buy or sell cryptocurrency and should not be viewed as an endorsement by CoinIdol.com. Readers should do their research before investing in funds.


