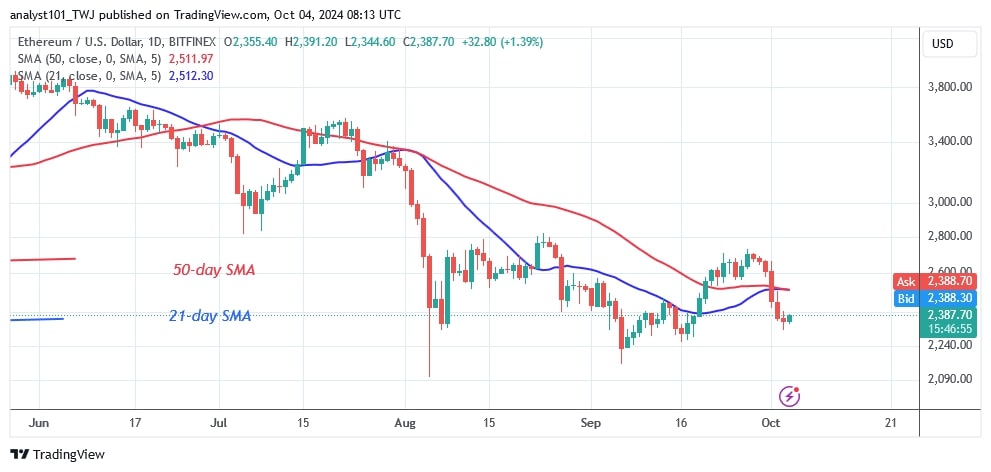
The price of Ethereum (ETH) has fallen below its moving average lines after rejecting the $2,800 resistance level. Price analysis by Coinidol.com.
Since August 4, buyers have been working together to keep the bullish momentum above the moving average lines and resistance at $2,800, as reported by Coinidol.com. A break above the $2,800 resistance level will catapult the altcoin to a high of $3,400.
Ethereum price long-term analysis: bearish
Today, the price of Ether has fallen to its range between $2,200 and $2,800. The largest altcoin has fallen and found support above the critical support level of $2,300. Ether is rising above the $2,300 support level and approaching the moving average lines. Since September 16, Ether has held above the $2,300 support but below the moving average lines. If the current support is broken, Ether will fall back to its previous lows of $2,200 and $2,000.
Analysis of the Ethereum price indicators
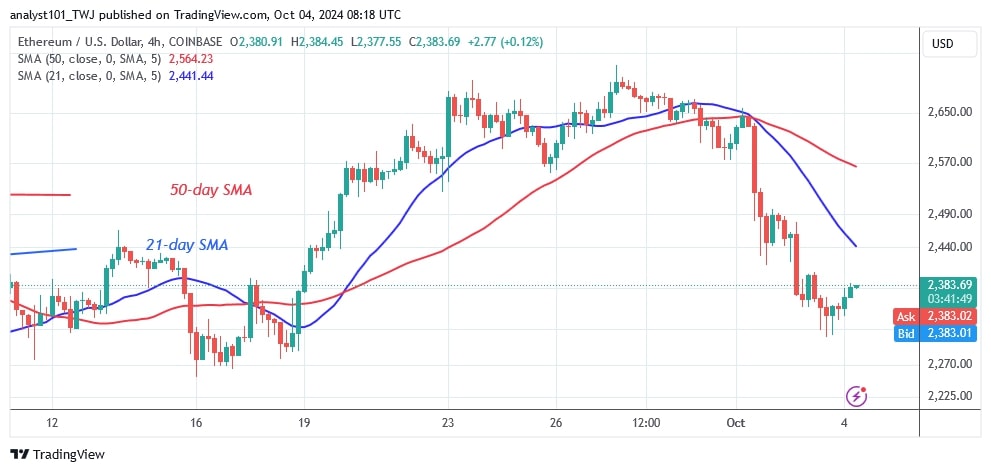
Ether has fallen back below the moving average lines and has resumed its trading range. The selling pressure could continue as the price bars are below the moving average lines. On the 4-hour chart, the moving average lines show a bearish crossover when the 21-day SMA falls below the 50-day SMA, which is a negative signal.
Technical Indicators:
Resistance Levels – $4,000 and $4,500
Support Levels – $3.500 and $3,000
Which way is Ethereum price heading next?
On the 4-hour chart, Ether is falling above the $2,300 support. The altcoin has established itself above the $2,300 low, with long candlestick tails indicating current support. The extended candlestick tail indicates significant buying pressure at the lower price point.

Disclaimer. This analysis and forecast are the personal opinions of the author. They are not a recommendation to buy or sell cryptocurrency and should not be viewed as an endorsement by CoinIdol.com. Readers should do their research before investing in funds.


