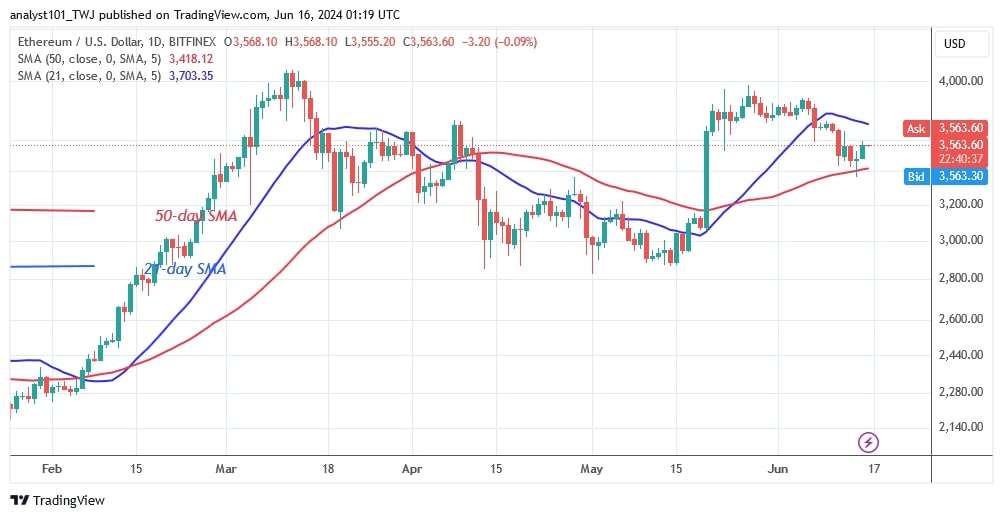
Ethereum (ETH) price has reversed its slide after hitting a low of $3,365 and rising above the 50-day SMA support. Price analysis by Coinidol.com.
Long-term analysis of the Ethereum price: bearish
If the bears successfully break the 50-day SMA, Ether will drop to a low of $3,000. The altcoin bounced back to reach a high of $3,566 at the time of writing.
If the uptrend breaks above the 21-day SMA, the altcoin could reach a high of $3,800. However, the largest altcoin will be forced to fluctuate between the moving average lines if it hits the resistance of the 21-day SMA.
Analysis of the Ethereum indicator
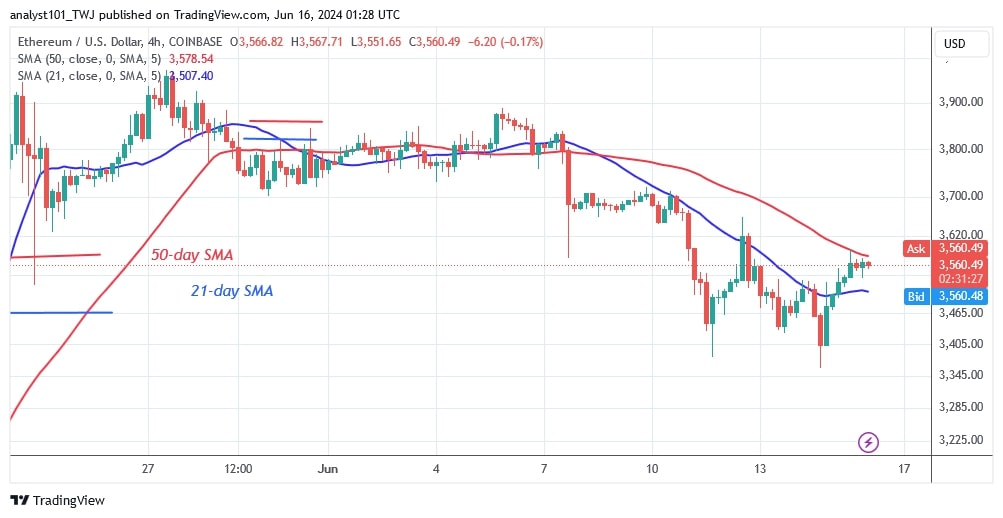
Ether price bars are in between the moving average lines and are unable to fall below the 50-day SMA support. The 50-day SMA support is holding as the altcoin resumes its uptrend. On the 4-hour chart, the price bars are between the moving average lines, but the upward movement is nipped in the bud by resistance at the 50-day SMA.
Technical indicators:
Key resistance levels – $4,000 and $4,500
Key support levels – $3,500 and $3,000
What is the next direction for Ethereum?
Ethereum prices are trapped between the moving average lines. The price movement is uncertain as the altcoin is trading in a narrow range. On the 4-hour chart, upside momentum is hindered by resistance at $3,620 and the 50-day SMA. The crypto signal is range-bound as it is trapped between the moving average lines.

Disclaimer. This analysis and forecast are the personal opinions of the author and are not a recommendation to buy or sell cryptocurrency and should not be viewed as an endorsement by CoinIdol.com. Readers should do their research before investing in funds.


