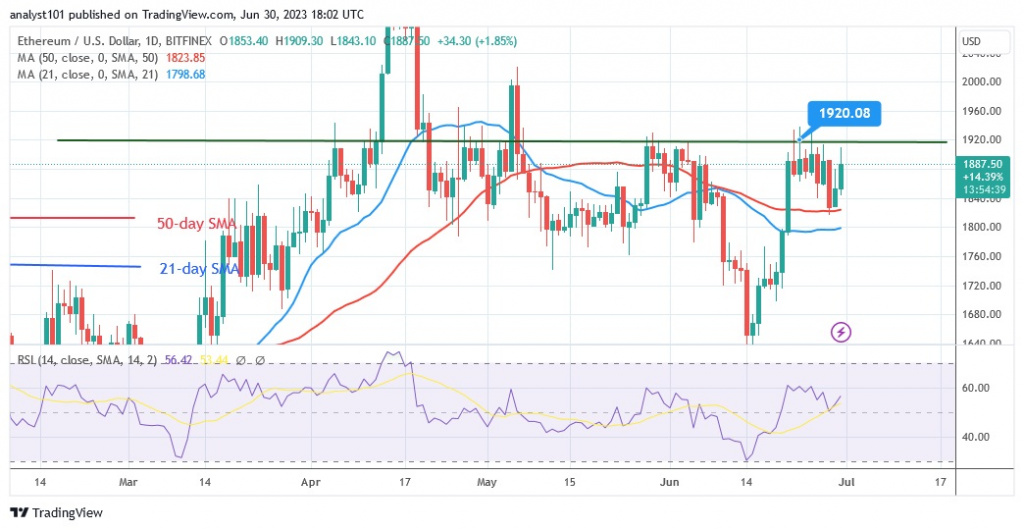
Cryptocurrency analysts of Coinidol.com report, the Ethereum price (ETH) has reached resistance at $1,920, but has retreated. This has been the price movement since the June 21 price rally.
Long-term analysis of the Ethereum price: bullish
In other words: Expecting a positive trend, the largest altcoin is fluctuating between $1,800 and $1,920.
If buyers can overcome the resistance level of $1,920, the altcoin will climb to the psychological mark of $2,000. On the downside, buyers are clinging to the $1,800 level. If the $1,800 support level is broken, Ether will fall above the $1,720 breakout level. As long as the resistance and support levels remain intact, the movement will continue in a certain range.
Analysis of Ethereum indicators
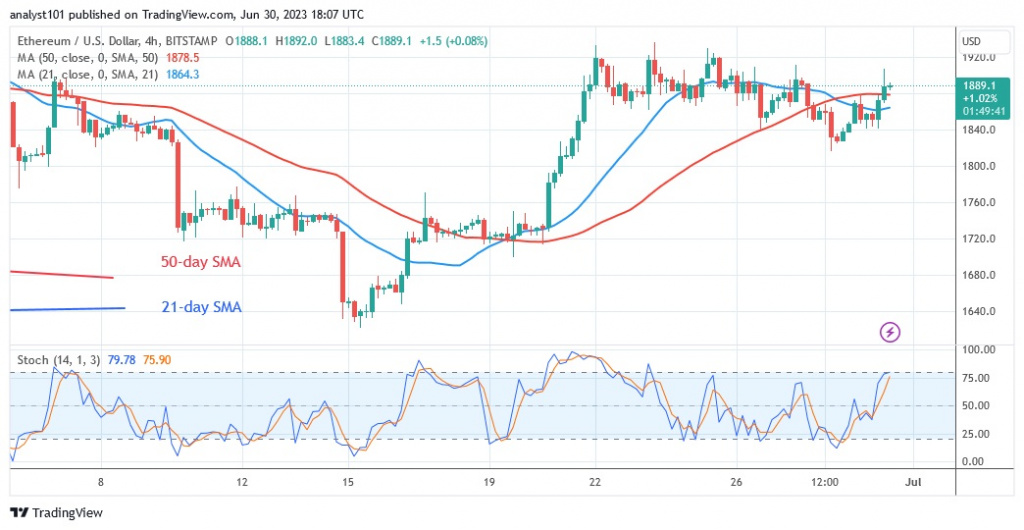
Ether is at level 56 of the Relative Strength Index for the period 14. The altcoin is in the bullish trend zone and is capable of further upward movement. Ether will rise as long as the price bars are above the moving average lines. Ether is in a bullish momentum. The daily stochastic is above the level of 80. Ether may decline if the market reaches the overbought zone.

Technical Indicators:
Key resistance levels – $1,800 and $2,000
Key support levels – $1,600 and $1,400
What is the next direction for Ethereum?
Ethereum is still trapped at the $1,920 level. The largest altcoin is currently trading between $1,800 and $1,920. Once the current support or resistance level is broken, it will either rise or fall. In the meantime, the bulls have managed to keep the bullish momentum above the moving average lines.

On Jun 26, 2023, Coinidol.com reported that: It is difficult for buyers to advance to the recent high since the June 21 bounce. Price action has stalled near the $1,900 high.
Disclaimer. This analysis and forecast are the personal opinions of the author and are not a recommendation to buy or sell cryptocurrency and should not be viewed as an endorsement by CoinIdol.com. Readers should do their research before investing in funds.


