The latest price analysis by Coinidol.com report, Ethereum (ETH) price has broken down after being stuck between the moving average lines.
Long-term analysis of the Ethereum price: bearish
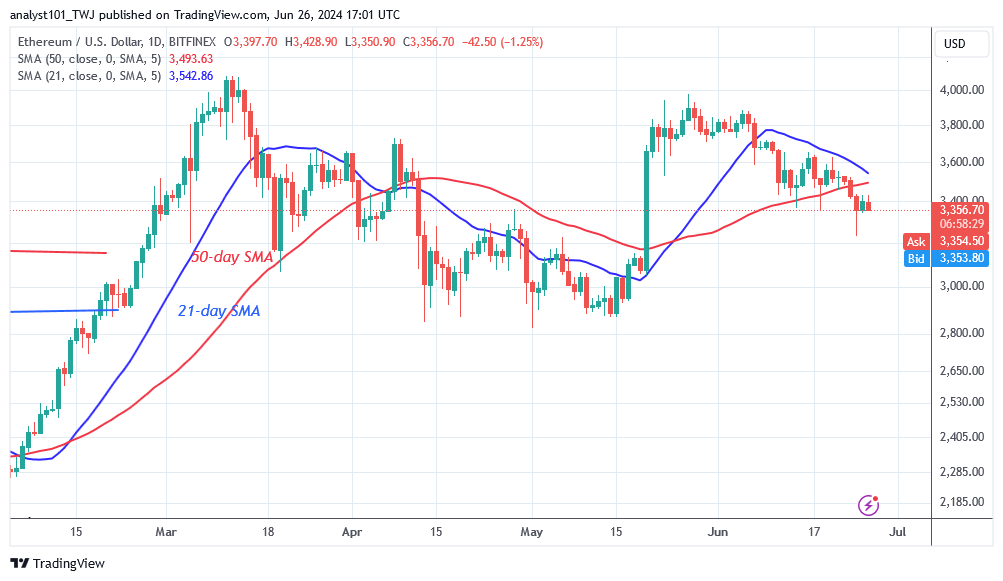
The bulls and bears have started a price battle for control of the market. After a two-week price battle, the bears have gained the upper hand after breaking the 50-day SMA or the critical support at $3,400. This resulted in the crypto price falling below the moving average lines as it hit the low of $3,231 and retreated. Ether has made an upward correction but was stalled at the high of $3,431. On the upside, Ether could regain momentum if the bulls break above the $3,400 resistance and the 21-day SMA. However, if the buyers fail to overcome the $3,400 resistance, Ether could fall back to the lows of $3,000 and $2,825. In the meantime, Ether’s value stands at $3,369 at the time of writing.
Analysis of the Ethereum indicators
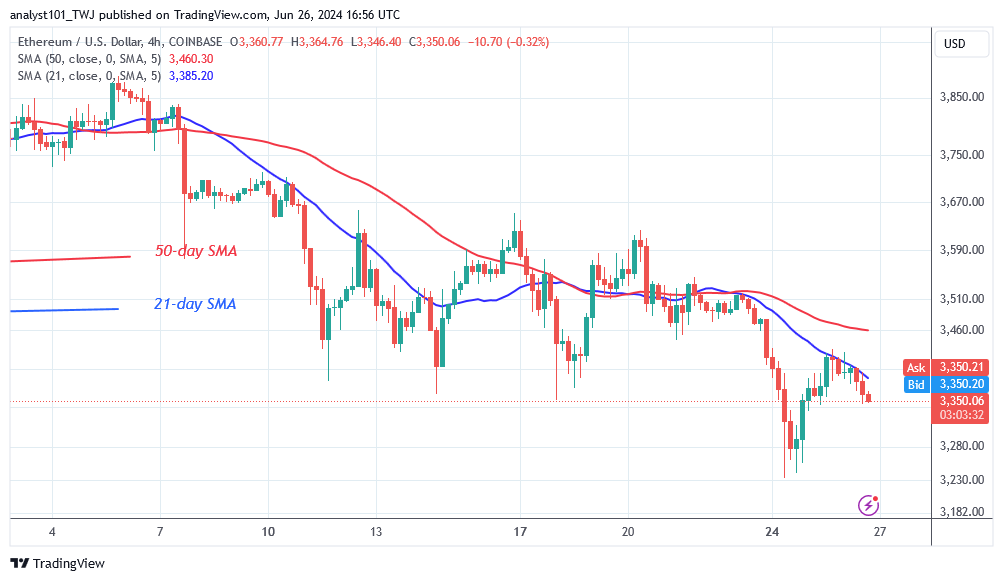
The price bars are now below the 21-day SMA and the 50-day SMA, which were previously trapped between the moving average lines. This indicates a further decline in the cryptocurrency while it is in the bearish trend zone. On the 4-hour chart, the moving average lines are showing a bearish crossover, which is a bearish signal.

Technical indicators:
Key resistance levels – $4,000 and $4,500
Key support levels – $3,500 and $3,000
What is the next direction for Ethereum?
On the 4-hour chart, Ether is below the moving average lines in a downtrend. The altcoin previously ranged between $3,400 and $3,640. The bears broke the current price range and reached the low of $3,233. The upside has stalled as Ether is forced into a narrow range between $3,200 and $3,400. The rejection of the recent high will cause Ether to decline.

On June 22, 2024 cryptocurrency analytics specialists of Coinidol.com stated that the largest altcoin has held solidly above the $3,400 support level, supported by the moving average lines.
Disclaimer. This analysis and forecast are the personal opinions of the author. They are not a recommendation to buy or sell cryptocurrency and should not be viewed as an endorsement by CoinIdol.com. Readers should do their research before investing in funds.


