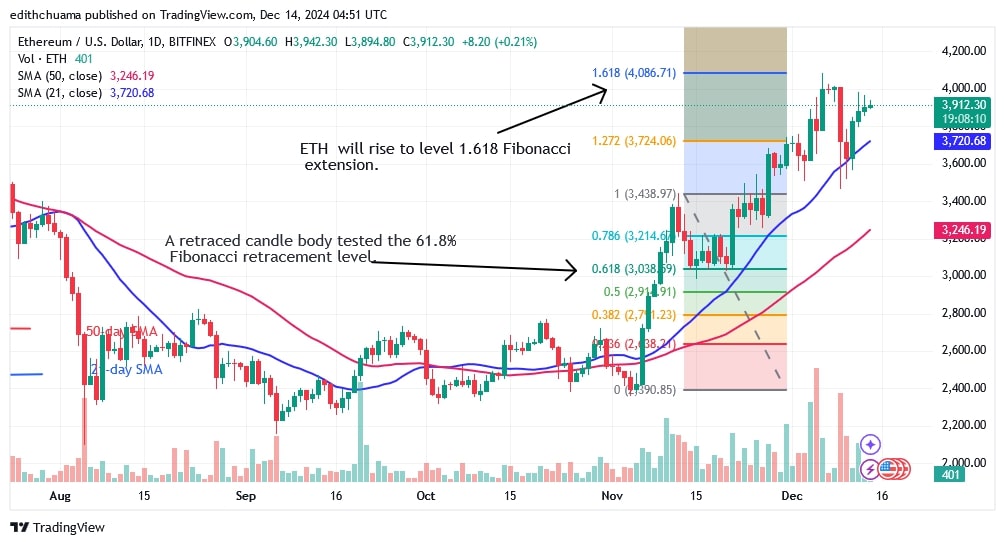
The price of Ethereum (ETH) resumed its uptrend on December 11 after rising above the 21-day SMA. ETH price analysis by Coinidol.com.
Long-term analysis of the Ethereum price: bullish
The bulls were unable to sustain the uptrend above the high of $4,000 on December 6. The bears defended the recent high and tried to push Ether below the 21-day SMA.
These two opportunities have resulted in the largest altcoin trading in a range between the 21-day SMA and resistance at $4,000.
Today, Ether is approaching the $4,000 level for the second time and is on a high. The bullish momentum has slowed down due to the doji candlesticks. If the current barrier is breached, it is likely that Ether’s value will rise above $4,000. The largest altcoin will reach another high of $4,500.
However, a rejection of the recent high will result in the altcoin continuing its sideways movement below the psychological price level.
Analysis of the Ethereum indicators
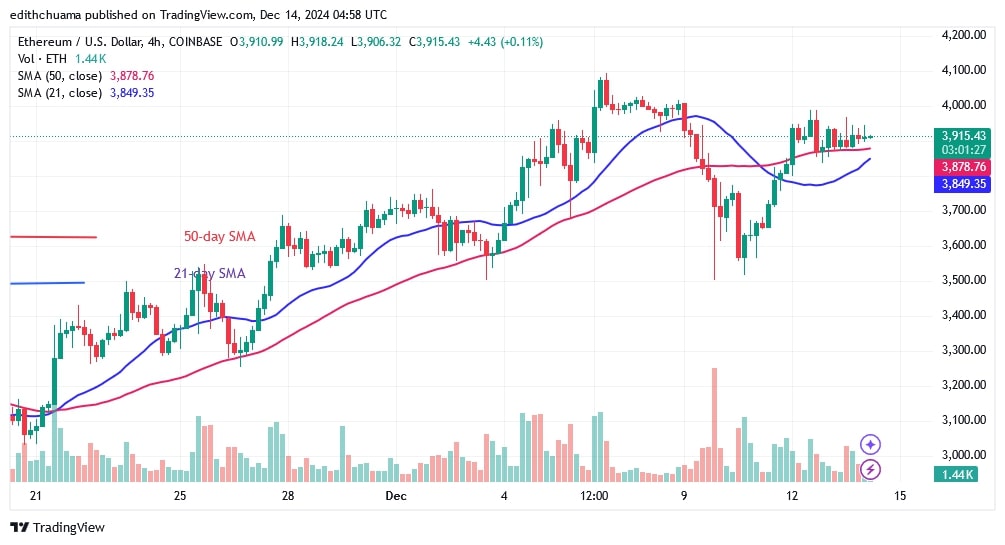
Ether’s price bars are above the moving average lines and continue to rise. The price bars are dominated by doji candlesticks, which means that the altcoin is hardly traded. The 4-hour chart shows Ether price bars above the horizontal moving average lines. Doji candlesticks are consolidating, making the forward movement dubious.
Technical Indicators:
Resistance Levels – $4,000 and $4,500
Support Levels – $3.500 and $3,000
What is the next direction for Ethereum?
Ether price is trading slightly above the $3,900 support, remaining range-bound. Since the end of the first uptrend, the largest altcoin has been trading above the $3,500 support and below the $4,000 high. Currently, the price movement is slow as Ether continues to consolidate.
On the upside, a price rise will break through the $4,000 mark.

Disclaimer. This analysis and forecast are the personal opinions of the author, are not a recommendation to buy or sell cryptocurrency, and should not be viewed as an endorsement by CoinIdol.com. Readers should do their research before investing in funds.


