Ethereum (ETH) price is falling below the moving average lines.
Long-term analysis of Ethereum price: bearish
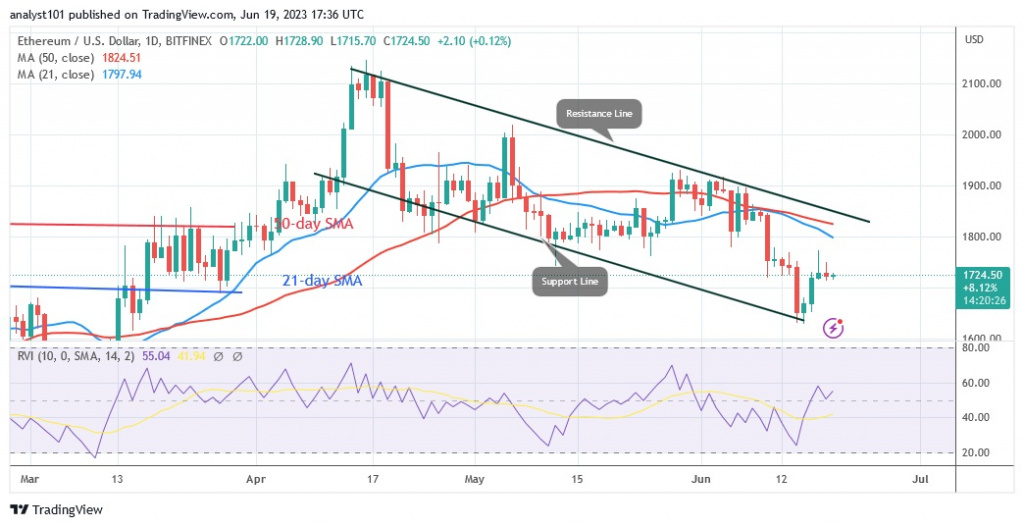
As bulls bought the dips, the downtrend broke below the critical support level of $1,700. Buyers pushed the largest altcoin above the support level of $1,700 today. At the time of writing, Ether was trading at $1,725.10. If the $1,700 support holds, the largest altcoin will resume its uptrend. The current support level will allow Ether to rise to previous highs of $1,800 and $1,900. If Ether falls below the $1,700 support, selling pressure will resume. Bears will break the $1,600 support and extend their downtrend to $1,370. Meanwhile, Ether is trading above its current support. The current bullish momentum will be tested.
Analysis of Ethereum indicators
Ether has reached its equilibrium price. For period 14, it is at a Relative Strength Index of 50, which means that supply and demand have reached an equilibrium point. The price bars below the moving average lines indicate that Ether is in a downtrend and is below the daily stochastic level of 30.

Technical Indicators:
Key resistance levels – $1,800 and $2,000
Key support levels – $1,600 and $1,400
Where does Ethereum go from here?
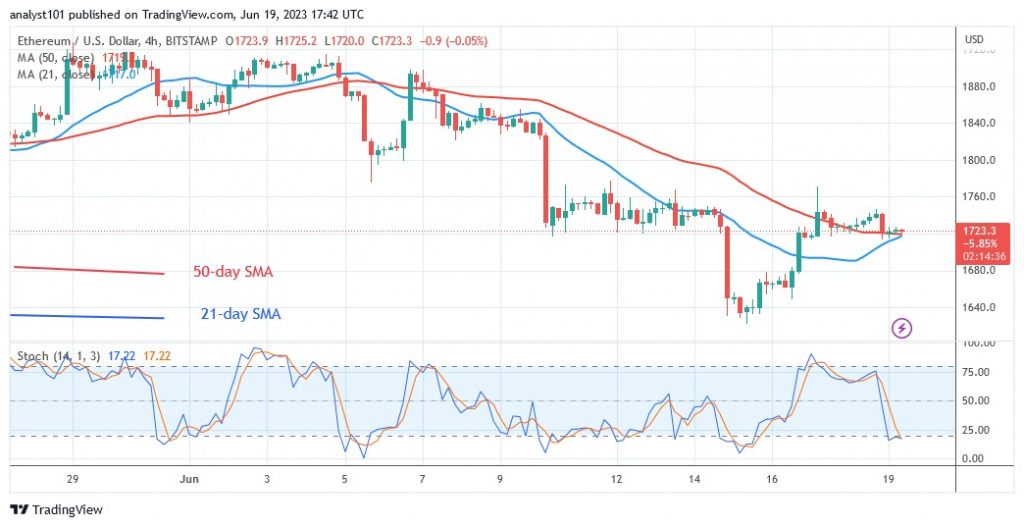
Ethereum has been trading above the $1,700 support level since June 14, with buyers and sellers battling for control of prices above the current support level. Currently, the uptrend is shaky as Ether is trading in the overbought zone of the market.

Disclaimer. This analysis and forecast are the personal opinions of the author and are not a recommendation to buy or sell cryptocurrency and should not be viewed as an endorsement by CoinIdol. Readers should do their research before investing in funds.


