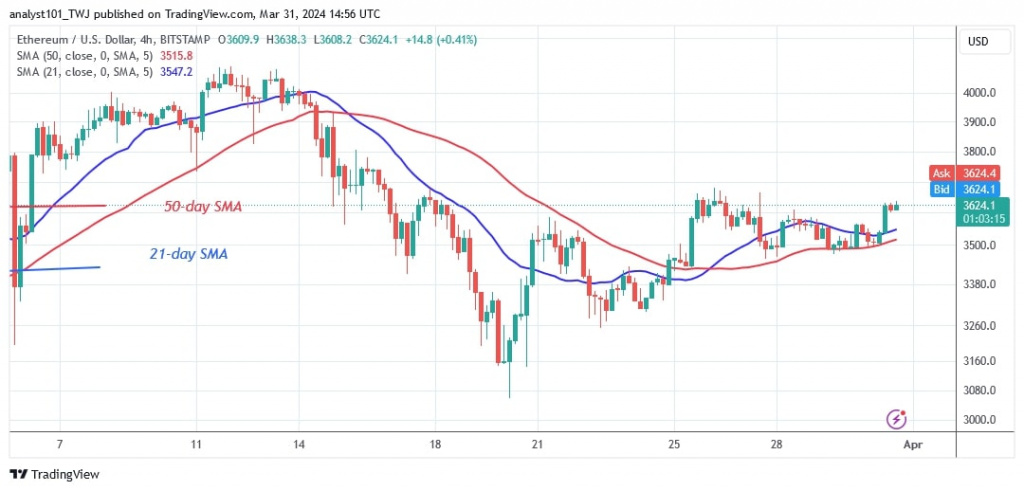
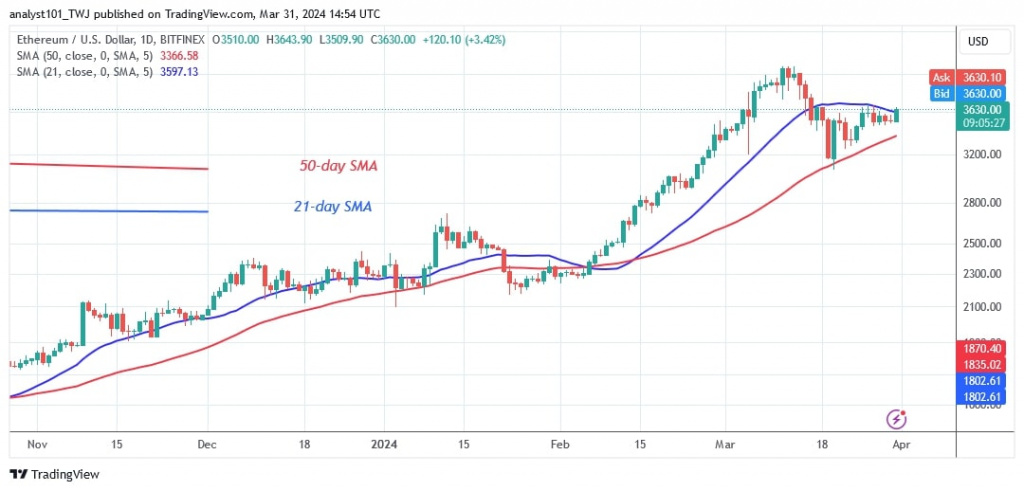
The price of Ethereum (ETH) has fallen between the moving average lines since March 19, 2024.
Long-term analysis of the Ethereum price: bearish
Bulls and bears have been battling over price action over the past week to determine the direction of the market. The bulls are struggling to break above the 21-day SMA after stopping the decline above the 50-day SMA. Currently, the largest altcoin is worth $3,440.
If the bulls manage to keep Ethereum above the 21-day SMA, it will rise. The positive trend will continue up to the previous high of $4,100. Ether’s price will continue to fluctuate if buyers fail to keep it above the 21-day moving average.
However, if the bears break the 50-day SMA support, the selling pressure on Ether will continue. Ether will then fall to a level above the $3,000 mark.
Analysis of the Ethereum indicators
Buyers are trying to break the 21-day SMA, but Ether’s price bars are still stuck between the moving average lines. The 4-hour chart shows price bars above the horizontal moving average lines, indicating a sideways trend. Ether is rising but is being pushed back from the $3,700 resistance zone.
Key resistance levels – $4,000 and $4,500
Key support levels – $3,500 and $3,000
What is the next direction for Ethereum?
Ethereum remains trapped between the moving average lines. Breaking the moving average lines will indicate the direction of the market. On the 4-hour chart, the price of Ether is moving between $3,280 and $3,700. Today, buyers are trying to break above the $3,600 resistance level. Once the resistance is broken, the altcoin will trend upwards.

Disclaimer. This analysis and forecast are the personal opinions of the author and are not a recommendation to buy or sell cryptocurrency and should not be viewed as an endorsement by CoinIdol.com. Readers should do their research before investing in funds.


