The price of Ethereum (ETH) has rallied twice above the 21-day simple moving average (SMA) in anticipation of a strong trend. Price analysis by Coinidol.com.
Long-term analysis of the Ethereum price: optimistic
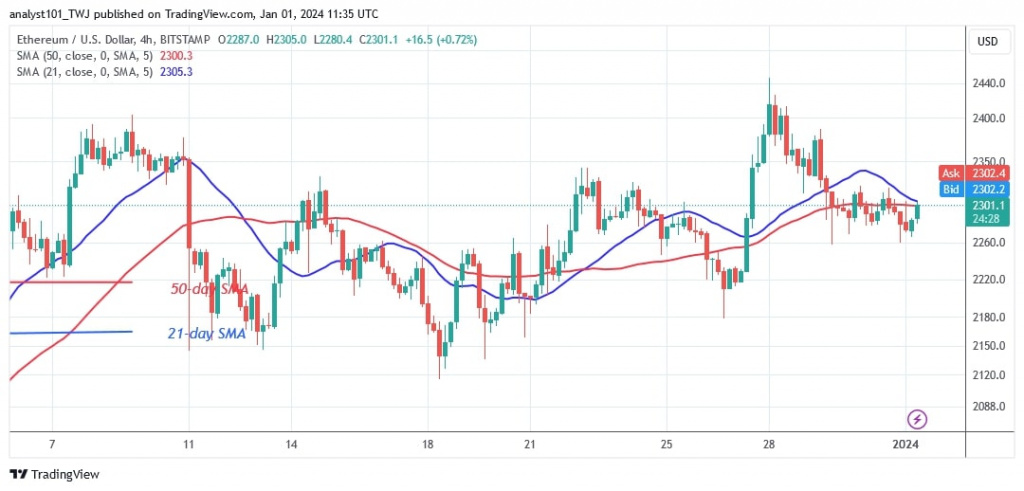
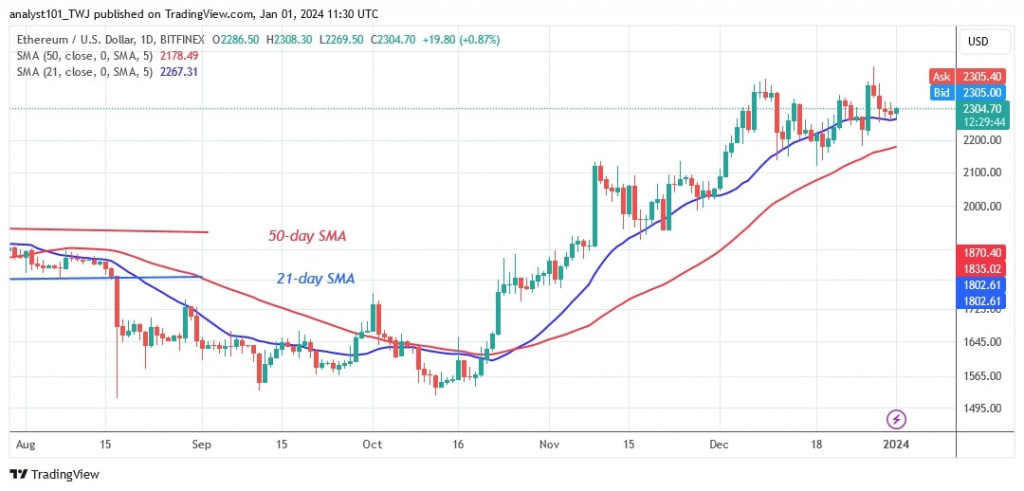
Ether rose to a high of $2,447 on December 28 but was rejected. The altcoin declined and found support above the 21-day simple moving average. Today, Ether is on the rise again, reaching a high of $2,305.50. Buyers are driving Ether back to previous highs. On the positive side, the bulls have tested the $2,400 resistance twice but have been beaten back each time. Buyers intend to push the altcoin above the $2,447 mark before moving towards the psychological price level of $3,000. On the downside, Ether may drop if the 21-day SMA is breached and the bearish momentum continues.
Analysis of the Ethereum indicators
The price of Ethereum is rising as it moves above the 21-day simple moving average. The 21-day SMA provides support for the cryptocurrency’s upward movement. The price bars on the 4-hour chart are above the horizontal moving average lines. The largest altcoin is also experiencing an overbought scenario in the cryptocurrency, which may lead to its decline.
Technical indicators:
Key resistance levels – $2,200 and $2,400
Key support levels – $1,800 and $1,600
What is the next direction for Ethereum?
Since the end of the December 7 rally, Ethereum has been trading in a narrow range. The altcoin’s price has fluctuated between $2,140 and $2,440, with bulls making two unsuccessful attempts to break above the $2,447 resistance level. If the range thresholds are breached, Ether will develop a trend.
The largest altcoin has continued its positive performance and reclaimed the $2,300 resistance level, as Coinidol.com reported last week.

Disclaimer. This analysis and forecast are the personal opinions of the author and are not a recommendation to buy or sell cryptocurrency and should not be viewed as an endorsement by CoinIdol.com. Readers should do the research before investing in funds.


