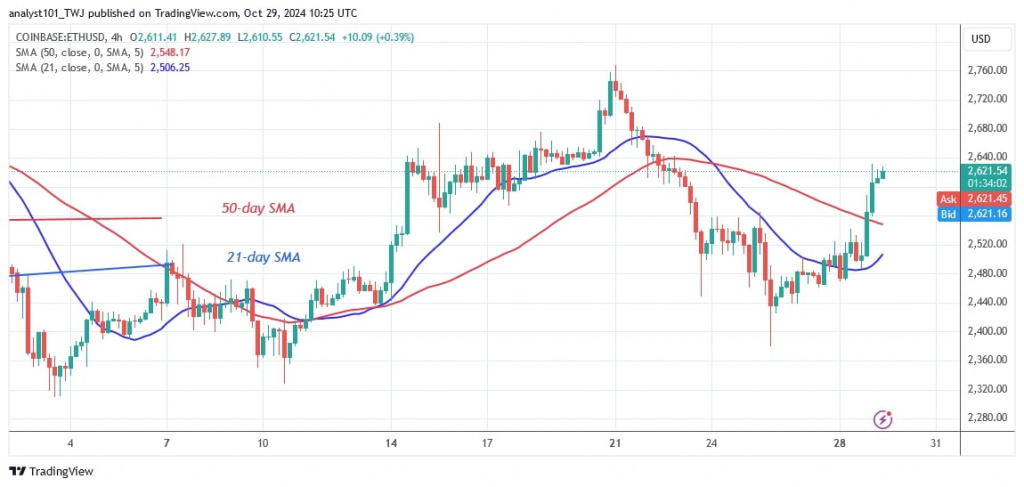
The price of Ethereum (ETH) has risen above the moving average after hitting a low of $2,379. ETH price analysis by Coinidol.com.
Long-term analysis of the Ethereum price: bullish
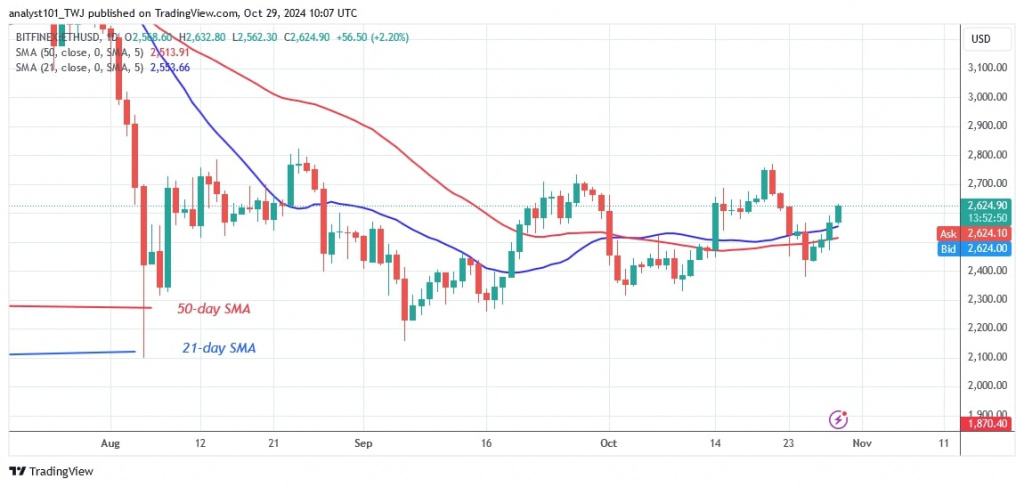
The largest altcoin has started a bullish climb as it approaches resistance at $2,800. The cryptocurrency has been trading between $2,200 and $2,800. This is the fifth time buyers have attempted to hold the price above $2,800. In previous attempts, Ether was rejected at the recent high, resulting in a sideways trend.
On the upside, a rise to $3,400 is likely if buyers break above the $2,800 resistance. However, if Ether falls from its recent high, the range-bound move will continue. Meanwhile, Ether is currently worth $2,628.
Ethereum indicator analysis
Ether will rise when the price bars return above the moving average lines. The moving average lines are horizontal, while the price bars fluctuate below and above them. The 21-day SMA is above the 50-day SMA, indicating a rise in the cryptocurrency. The altcoin will continue to fall if the 21-day SMA is below the 50-day SMA.
Technical Indicators:
Resistance Levels – $4,000 and $4,500
Support Levels – $3.500 and $3,000
What is the next direction for Ethereum?
Ether is reversing its recent slide below the moving average lines. It is rising and approaching the previous high of $2,800. The price will face resistance as it approaches $2,600. On October 14, Ether was rejected at $2,600 before finally breaking out, as reported by Coinidol.com. Currently, the price is giving little back from its recent high.

Disclaimer. This analysis and forecast are the personal opinions of the author. They are not a recommendation to buy or sell cryptocurrency and should not be viewed as an endorsement by CoinIdol.com. Readers should do their research before investing in funds.


