The price of Ethereum (ETH) has remained strong, fluctuating above the $2,500 support but stuck below the $2,700 zone. ETH price analysis by Coinidol.com.
Long-term analysis of the Ethereum price: bullish
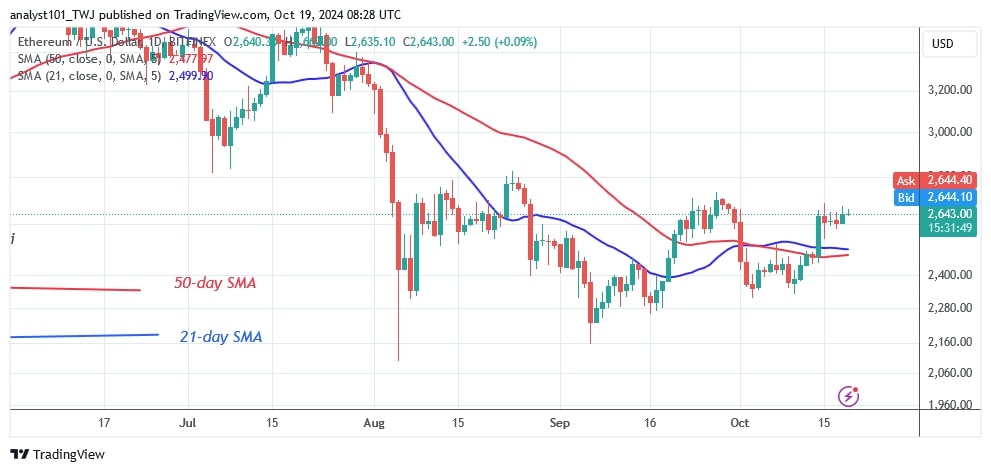
Over the past two months, the largest altcoin has been forced to trade within a range of $2,200 to $2,800. The uptrend was slowed down by resistance at $2,700 and $2,850.
Today, Ethereum is trading below the resistance level of $2,700. Buyers have not managed to keep the price above $2,700 as doji candlesticks have formed. The candlesticks have delayed the upward movement of the price. On October 19, Ether is trading at $2,648. If the current barrier is breached, the altcoin will rise even higher to $2,800 and $3,400.
The price of the altcoin will decline if it falls from its recent high. Ether will fall above the moving average lines or the $2,400 support.
Ethereum indicator analysis
Ether has held above the moving average lines since the breakout on October 14, as Coinidol.com wrote. The price bars are above the moving average lines but remain below the $2,700 resistance zone. In addition, the doji candlesticks have kept the price of the cryptocurrency stable above the moving average lines.
Technical Indicators:
Resistance Levels – $4,000 and $4,500
Support Levels – $3.500 and $3,000
What is the next direction for Ethereum?
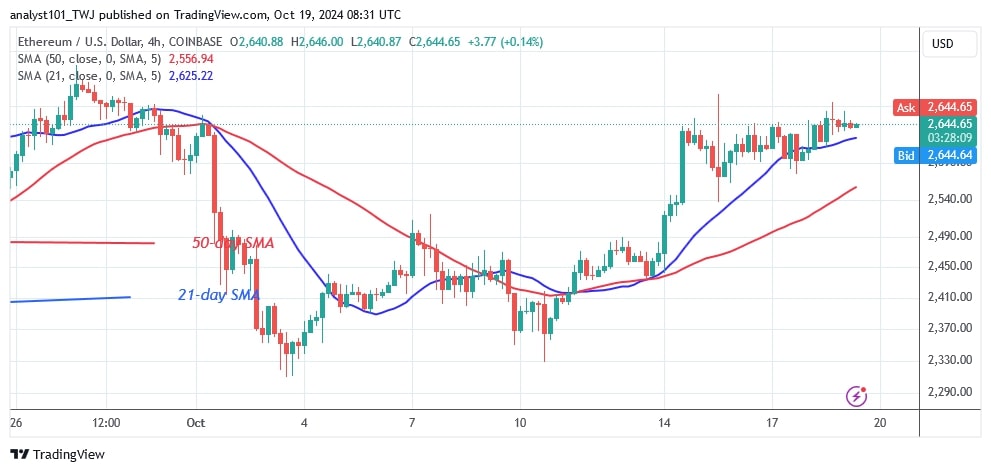
On the 4-hour chart, Ether is making an upward correction while remaining in a horizontal trend. The altcoin has gained but remains trapped at the $2,600 support. Buyers are struggling to sustain the bullish momentum above the recent high. Currently, the price of the cryptocurrency is consolidating above the $2,600 level and the moving average line. Ether could see a rally or a breakdown.

Disclaimer. This analysis and forecast are the personal opinions of the author. They are not a recommendation to buy or sell cryptocurrency and should not be viewed as an endorsement by CoinIdol.com. Readers should do their research before investing in funds.


