Ethereum (ETH) is already trading at the psychologically important $3,000 mark. Price analysis by Coinidol.com.
Long-term analysis of the Ethereum price: bullish
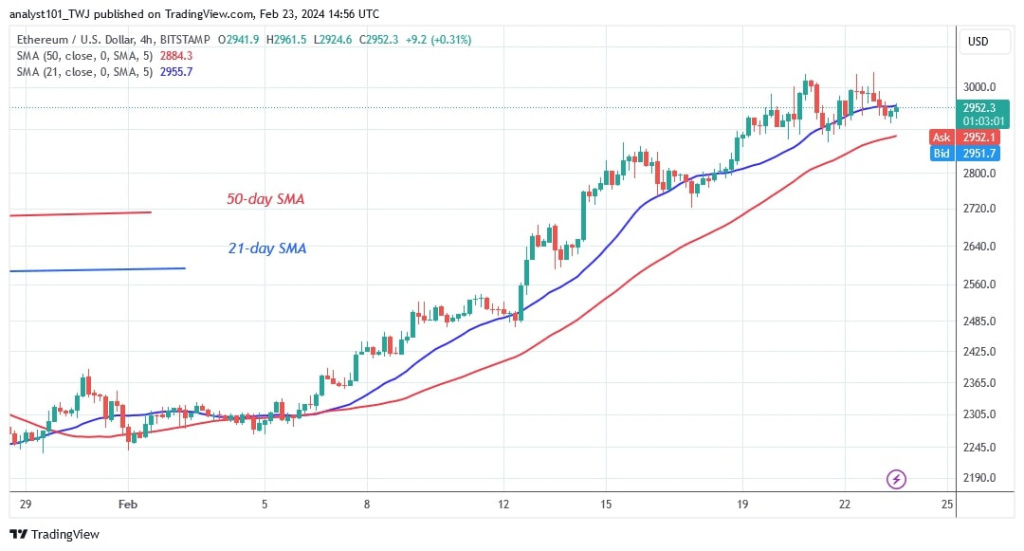
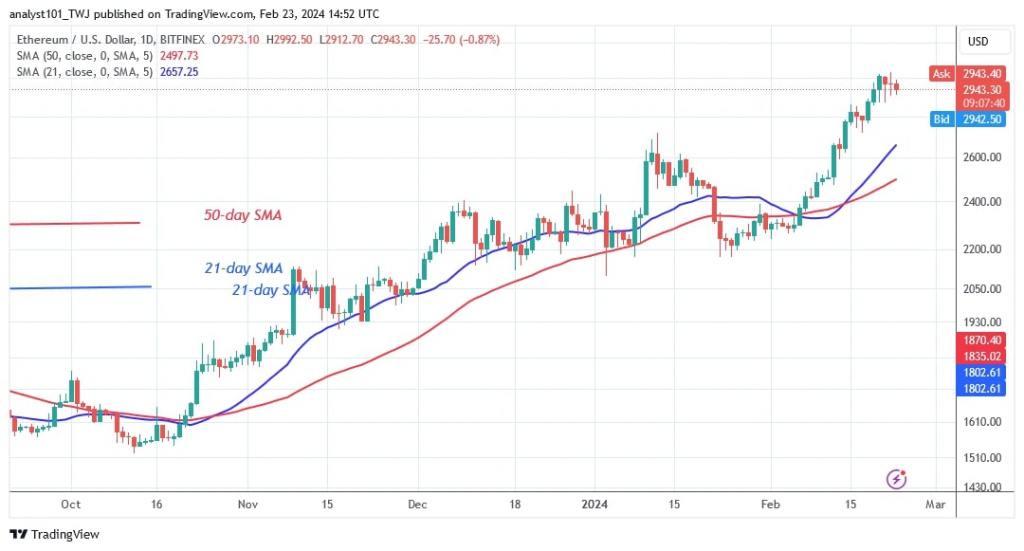
The cryptocurrency price tested its recent high three times before retreating. The largest altcoin reached a high of $3,036 before falling back again. The current uptrend will continue if the altcoin falls back above the $2,900 support level. Ether will rise and retest its high of $3,000. If the current resistance is broken, the altcoin could rise to a high of $3,300.
On the other hand, if the altcoin falls back below the $2,700 support, the current uptrend will be wiped out. Ether would then fall even lower below the 21-day SMA or the $2,600 support. In the meantime, Ether is fluctuating between $2,900 and $3,000 in anticipation of a future upswing in the cryptocurrency.
Analysis of the Ethereum indicators
Ether price bars are dominated by doji candlesticks that are above the moving average lines. This shows that the uptrend is continuing. On the 4-hour chart, the price bars have retraced between the moving average lines, indicating a probable sideways trend for a few days.
Technical indicators
Key resistance levels – $2,600 and $2,800
Key support levels – $2,400 and $2,200
What’s next for Ethereum?
Ether’s rising trend has exceeded its price target of $3,000. The largest altcoin is in a retracement and trading in a small range on the 4-hour chart. Ether is trapped between the moving average lines and is trading in the $2,900 to $3,000 price range. The current pullback could continue if Ether falls below the $2,700 support level.

Disclaimer. This analysis and forecast are the personal opinions of the author and are not a recommendation to buy or sell cryptocurrency and should not be viewed as an endorsement by CoinIdol.com. Readers should do their research before investing in funds.


