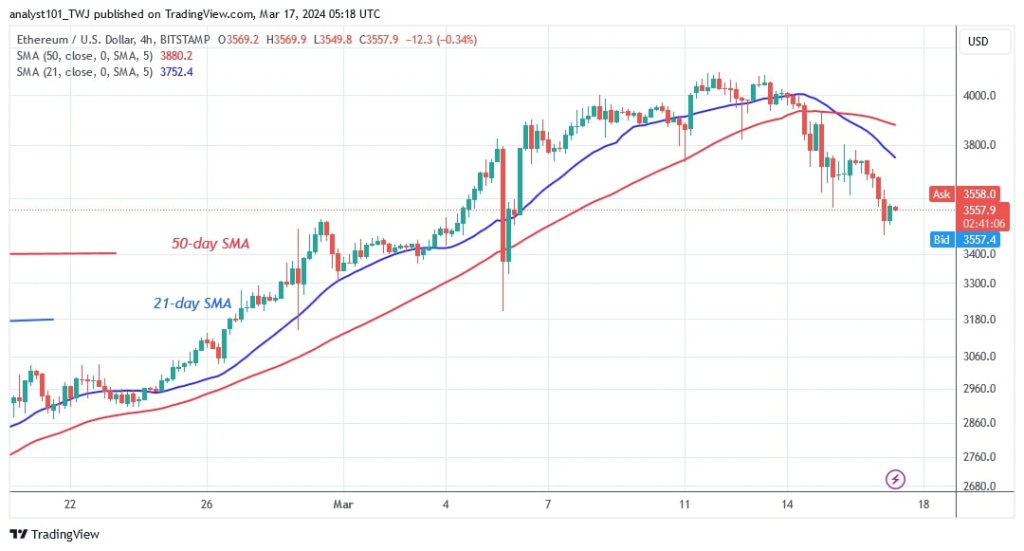
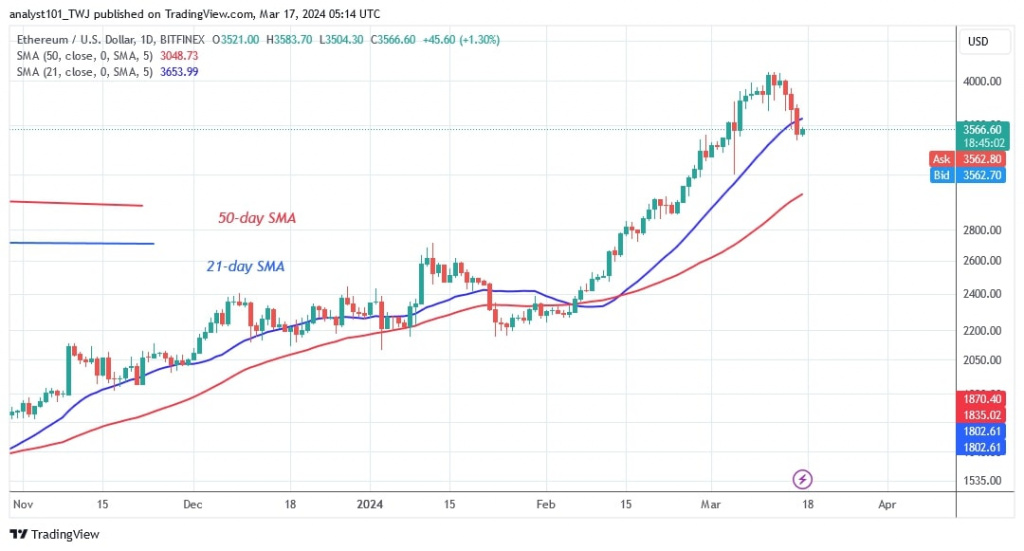
The price of Ethereum (ETH) is falling between moving average lines after hitting resistance at $4,082.
Long-term analysis of the Ethereum price: bearish
Since March 8, buyers have made several attempts to keep the price above the psychological $4,000 level, as reported by Coinidol.com. On the downside, the decline has slowed above the $3,400 support. However, if the bears break below the $3,400 support, the altcoin will drop to a floor above the 50-day SMA or the $3,050 level. However, if the bulls break above the 21-day SMA, Ether will resume its uptrend. The positive momentum will continue to the previous high.
If the bulls break through the psychological $4,000 level, Ether will start its second uptrend. Ether will see an initial rise to a high of $4,300. In the meantime, Ether is trading at $3,589 at the time of writing.
Ethereum indicator analysis
Ethereum’s price movement has been constrained by its positioning within the moving average lines. The altcoin is below the 21-day SMA but above the 50-day SMA. Once the moving average lines are broken, Ether will develop a new trend. On the 4-hour chart, the price bars have fallen dramatically below the moving averages.
Technical indicators:
Key resistance levels – $4,000 and $4,500
Key support levels – $3,500 and $3,000
What is the next direction for Ethereum?
Ethereum is currently falling below the moving average line on the 4-hour chart. The largest altcoin is trading above $3,400, with $4,000 serving as resistance. On March 5, the price of the cryptocurrency breached the current support level of $3,400, but the bulls bought the dips. Today, Ether has regained its positive momentum and is rising.

Disclaimer. This analysis and forecast are the personal opinions of the author and are not a recommendation to buy or sell cryptocurrency and should not be viewed as an endorsement by CoinIdol.com. Readers should do their research before investing in funds.


