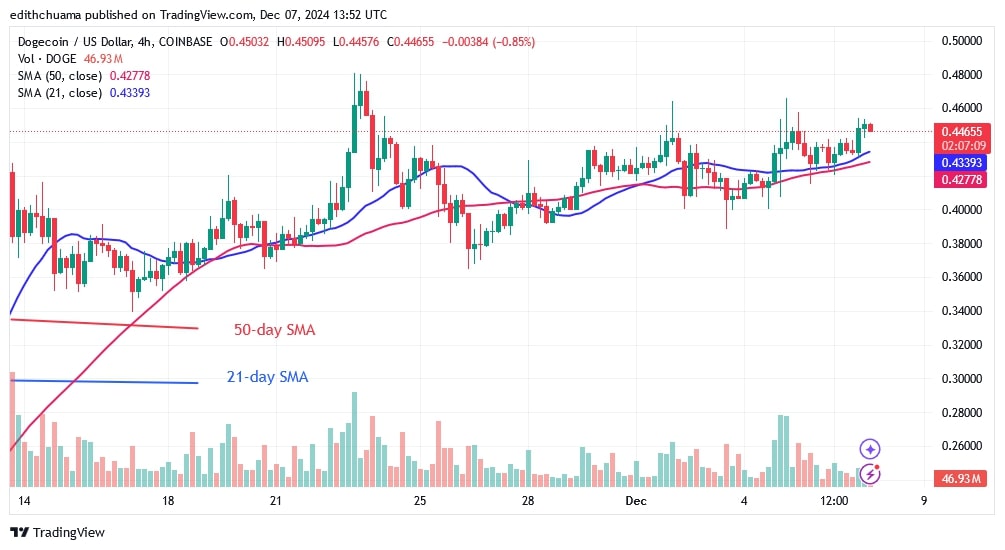
Today, Dogecoin (DOGE) is hovering around $0.43-$0.44. Price analysis by Coinidol.com.
DOGE price long term forecast: ranging
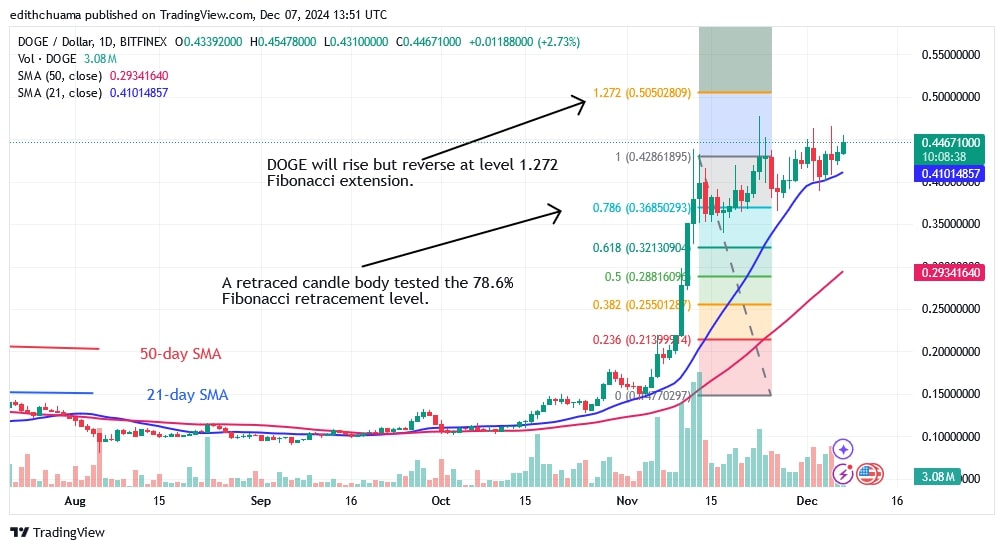
Dogecoin price continues to fluctuate sideways since the uptrend was interrupted on November 12. The bullish momentum persisted at the $0.45 resistance as DOGE continues to trade sideways above the moving average lines. The bulls have an advantage when it comes to pushing the altcoin higher as it trades above the moving average lines.
If the bulls break through the resistance at $0.45, DOGE will rise to highs of $0.50 and $0.52. DOGE will fall above the 50-day SMA support or the $0.30 low if the bears break below the 21-day SMA support.
Dogecoin indicator reading
The 21-day and 50-day SMAs have continued to rise despite the recent reversal. The upswing could continue as the price bars remain above the moving average lines. There are candlestick wicks pointing towards the resistance zone, indicating strong selling pressure. On the 4-hour chart, the moving average lines are horizontal, indicating a sideways trend.
Technical indicators
Resistance Levels $0.45 and $0.50
Support Levels – $0.30 and $0.25
What’s next for Dogecoin?
The presence of doji candlesticks on the 4-hour chart makes DOGE’s next move unpredictable. The price bars are moving both below and above the moving average lines. On the upside, the candlestick wicks are more visible, indicating a possible decline in the cryptocurrency. DOGE is slipping as it faces the rejection of its recent high.

Disclaimer. This analysis and forecast are the personal opinions of the author, are not a recommendation to buy or sell cryptocurrency, and should not be viewed as an endorsement by CoinIdol.com. Readers should do their research before investing in funds.


