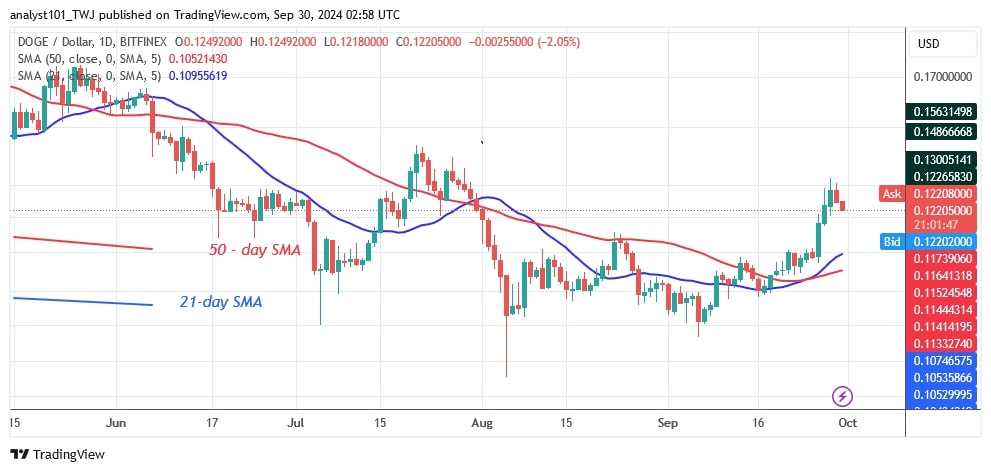
The price of Dogecoin (DOGE) has fallen after a failed upward correction. On September 28, DOGE rose to a high of $0.132 before being rejected.
DOGE price long-term prediction: bullish
DOGE would have reached a high of $0.18 if the current barrier had been breached.
Meanwhile, the cryptocurrency is falling towards the moving average lines. The decline is forecast to a low of $0.102. Further upward movement of the price is unlikely if the price falls below the moving average lines.
On the other hand, DOGE will resume its uptrend if it finds support above the $0.10 level. In the meantime, the altcoin is trading above its moving average lines.
DOGE price indicators reading
DOGE is bearish after rejecting its high at $0.132. The price bars are falling below the 21-day SMA but rising above the 50-day SMA support. The cryptocurrency is likely to be trapped between the moving average lines. DOGE will develop a trend if the price falls below the 21-day SMA resistance or the 50-day SMA support.
Technical indicators
Key resistance levels $0.22 and $0.24
Key support levels – $0.14 and $0.12
What is the next direction for Dogecoin?
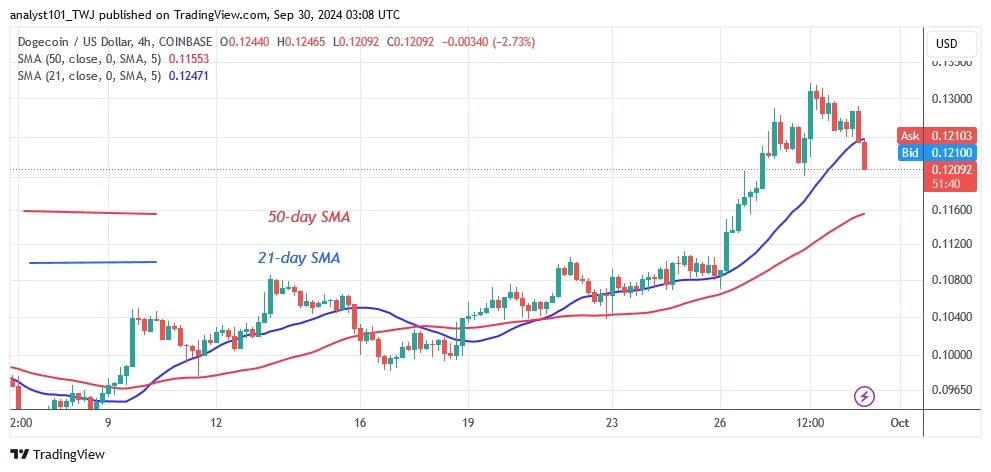
The DOGE price has fallen between the moving average lines on the 4-hour chart. It is predicted that the altcoin will reach a low of $0.102. This means that the altcoin will fall even further below the moving average lines.
On the downside, the price of the cryptocurrency has fallen below the 21-day SMA, with the bearish momentum spreading to the support of the 50-day SMA.

Disclaimer. This analysis and forecast are the personal opinions of the author. They are not a recommendation to buy or sell cryptocurrency and should not be viewed as an endorsement by CoinIdol.com. Readers should do their research before investing in funds.


