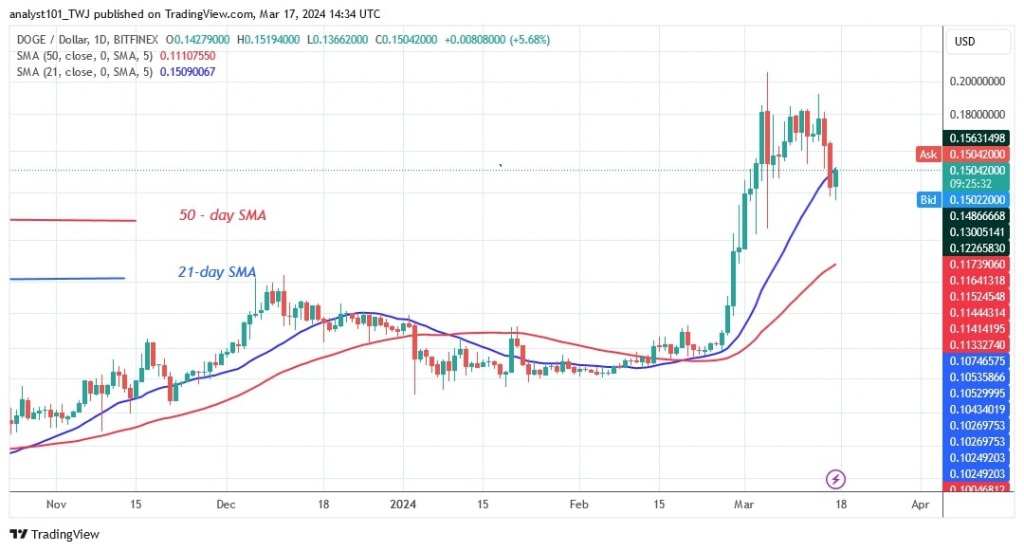
The price of Dogecoin (DOGE) has fallen below the 21-day SMA after reaching resistance at $18.
Long-term outlook for Dogecoin price: bullish
In the previous price action, DOGE was in an uptrend and rose to a high of $0.20 on March 5, as Coinidol.com reported. On March 5, the bulls and bears were in a price war as DOGE declined sharply, but the bulls bought the dips. The cryptocurrency made an upward correction and was forced into a sideways trend below the resistance at $0.18.
However, the buyers could not push the altcoin to the previous high as they were rejected at the $0.18 high. Today, DOGE is below the 21-day SMA but above the 50-day SMA. At the time of writing, it is worth $0.14.
On the downside, DOGE will fall further to the low above the 50-day SMA or $0.11 if the selling pressure continues. On the downside, if the current support at $0.14 holds, DOGE will return to the previous high by breaking above the 21-day SMA.
Dogecoin indicator reading
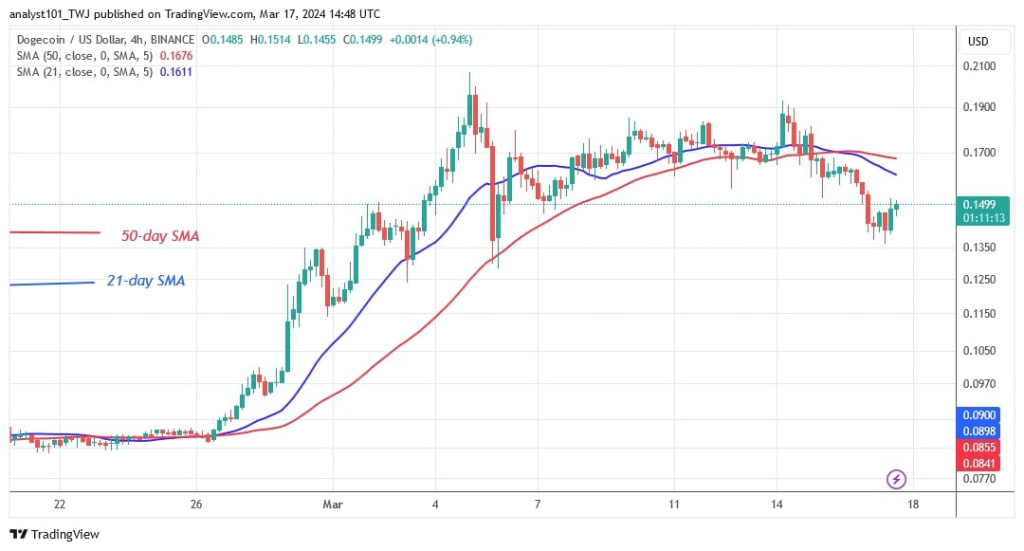
DOGE has moved between the moving average lines. The altcoin will be forced to fluctuate between the moving average lines. It will resume its trend when it breaks above the moving average lines. On the 4-hour chart, the price bars are below the moving average lines.
Technical indicators
Key resistance levels – $0.12 and $0.14
Key support levels – $0.06 and $0.04

What is the next direction for Dogecoin?
DOGE is falling below the moving average lines while finding support above the $0.135 level. On March 5, DOGE retested its current support level of $0.135, but the bulls bought the dips. Today, DOGE is gaining value and trying to resume the uptrend above the current support level. If the altcoin loses its existing support, it will lose value.

Disclaimer. This analysis and forecast are the personal opinions of the author and are not a recommendation to buy or sell cryptocurrency and should not be viewed as an endorsement by CoinIdol.com. Readers should do their research before investing in funds.


