The price of Cardano (ADA) is declining in a sideways pattern. Price analysis by Coinidol.com.
Long-term forecast for Cardano price: ranging
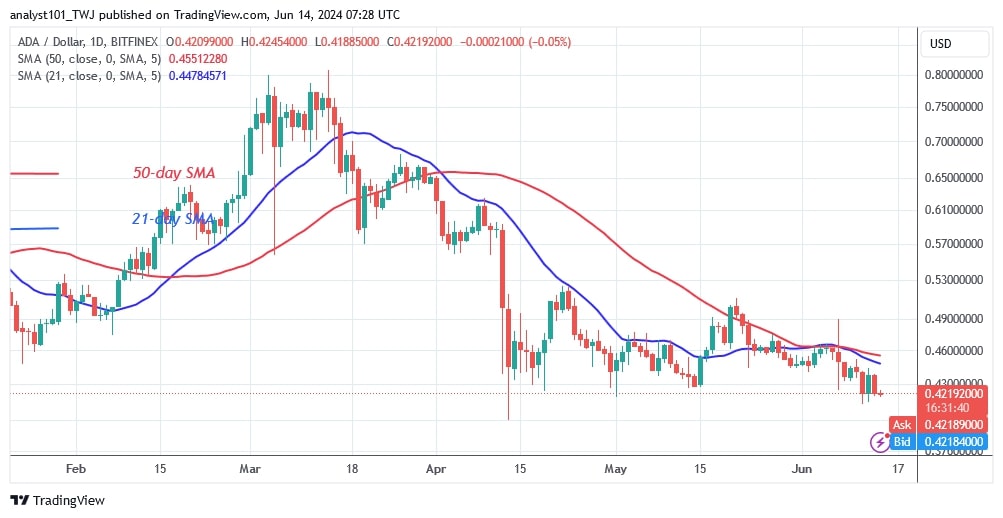
Resistance at $0.49 and the moving average lines have slowed the uptrend. On June 7, the altcoin was rejected at the $0.49 resistance level and ADA fell below the moving average lines. The price of the coin has fallen to between $0.42 and $0.49. Since June 11, the decline has been halted above the $0.42 level.
If the current support level holds, the downward movement will continue in the area of the downtrend. Buyers will try to keep the price above the moving average lines. However, if the current support is broken, the ADA price will fall to its previous low of $0.40. In the meantime, the Cardano price has not fallen below $0.40 since the April 12 plunge.
Analysis of the Cardano indicators
The ADA price bars have been trading below the moving average lines over the past week as the bears try to push the cryptocurrency lower. On the daily chart, the 21-day SMA is below the 50-day SMA, signaling a bearish crossover. Cardano could fall further as it is trading in a bearish trend zone.
Technical indicators
Key resistance zones: $0.80, $0.85 and $0.90
Key support zones: $0.50, $0.45 and $0.40
What is the next move for Cardano?
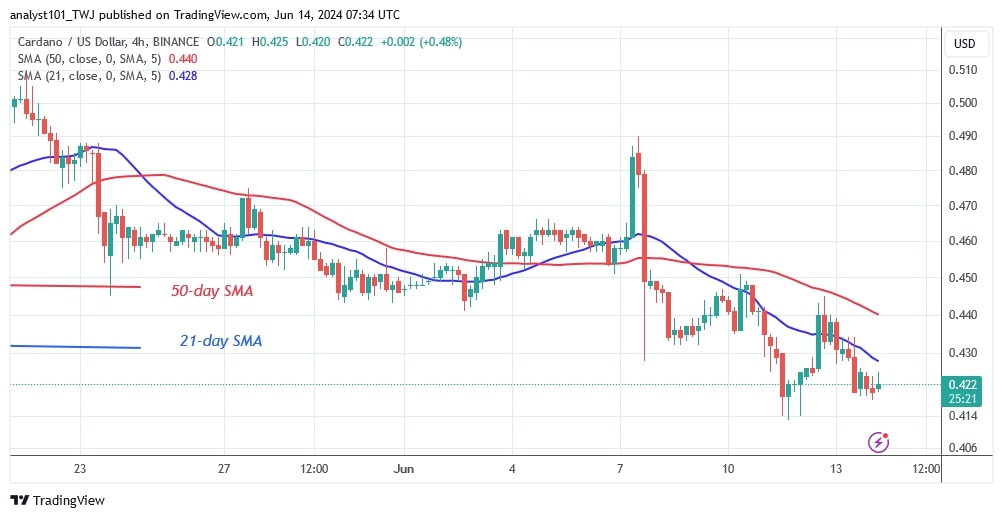
On the 4-hour chart, Cardano has fallen above the lower price area. The price of the cryptocurrency has breached the existing support three times and then recovered above it. The altcoin is trading near $0.42 and below the moving average lines. The price of the cryptocurrency will rise or fall as it trades in a narrow range.

Disclaimer. This analysis and forecast are the personal opinions of the author and are not a recommendation to buy or sell cryptocurrency and should not be viewed as an endorsement by CoinIdol.com. Readers should do their research before investing in funds.


