- Cardano price is up 40% since the June 10 low of $0.22, sustaining above an uptrend line with prospects for more gains.
- Santiment analytics attributes the rally to growing development activity on the network, with ADA beating Ethereum in third place.
- As the token fills a triangle, a breakout with the directional bias pending confirmation is imminent.
Cardano (ADA) price has managed to sustain along an ascending trendline for almost two months, recording higher highs and higher lows. The positive outlook remains pronounced despite traders cashing in from the July 13 rally when overflows from the Ripple’s partial victory in the XRP versus SEC lawsuit boded well for tokens the financial regulator had labeled securities.
Also Read: Solana Foundation, Immunefi, and Trail of Bits launch web3 security standard: Rekt or not?
Cardano price shows off with ADA ranking in top three on development activity metrics
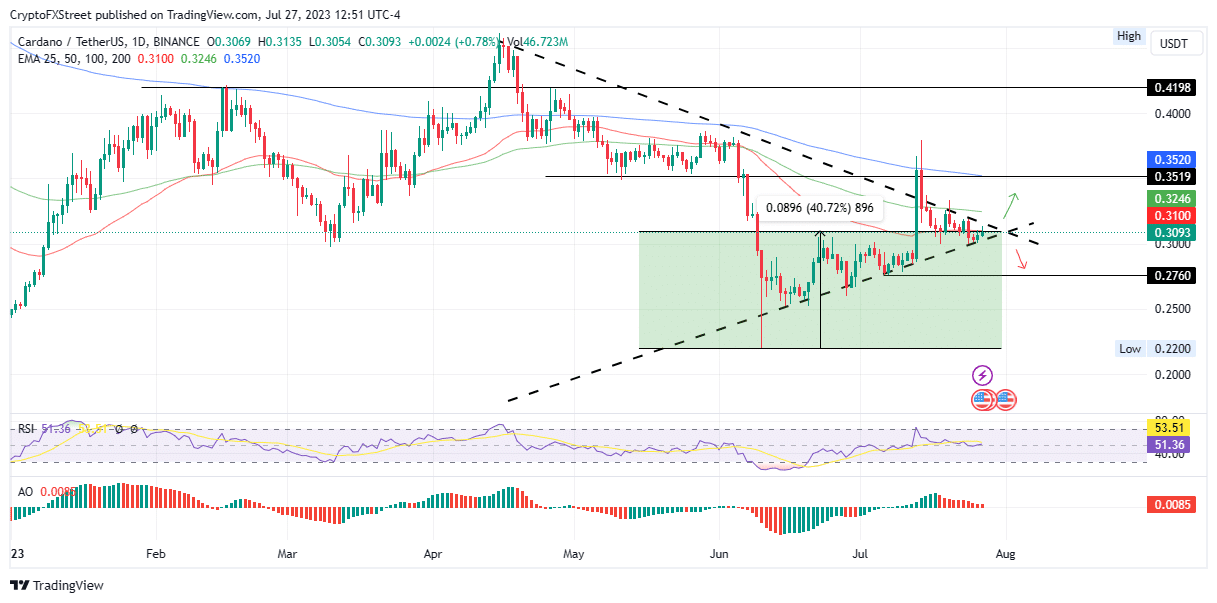
Cardano (ADA) price is showing off with 40% gains since June 10 as it continues to consolidate along an uptrend line. To the upside, profit-taking has capped ADA from reaching higher as investors quickly book profits from brief rallies. Case in point, most of the gains from the 30% surge on July 13 have already been booked. With buyers and sellers making counteracting traffic, ADA price action is now filling up a pennant.
ADA/USDT 1-Day Chart
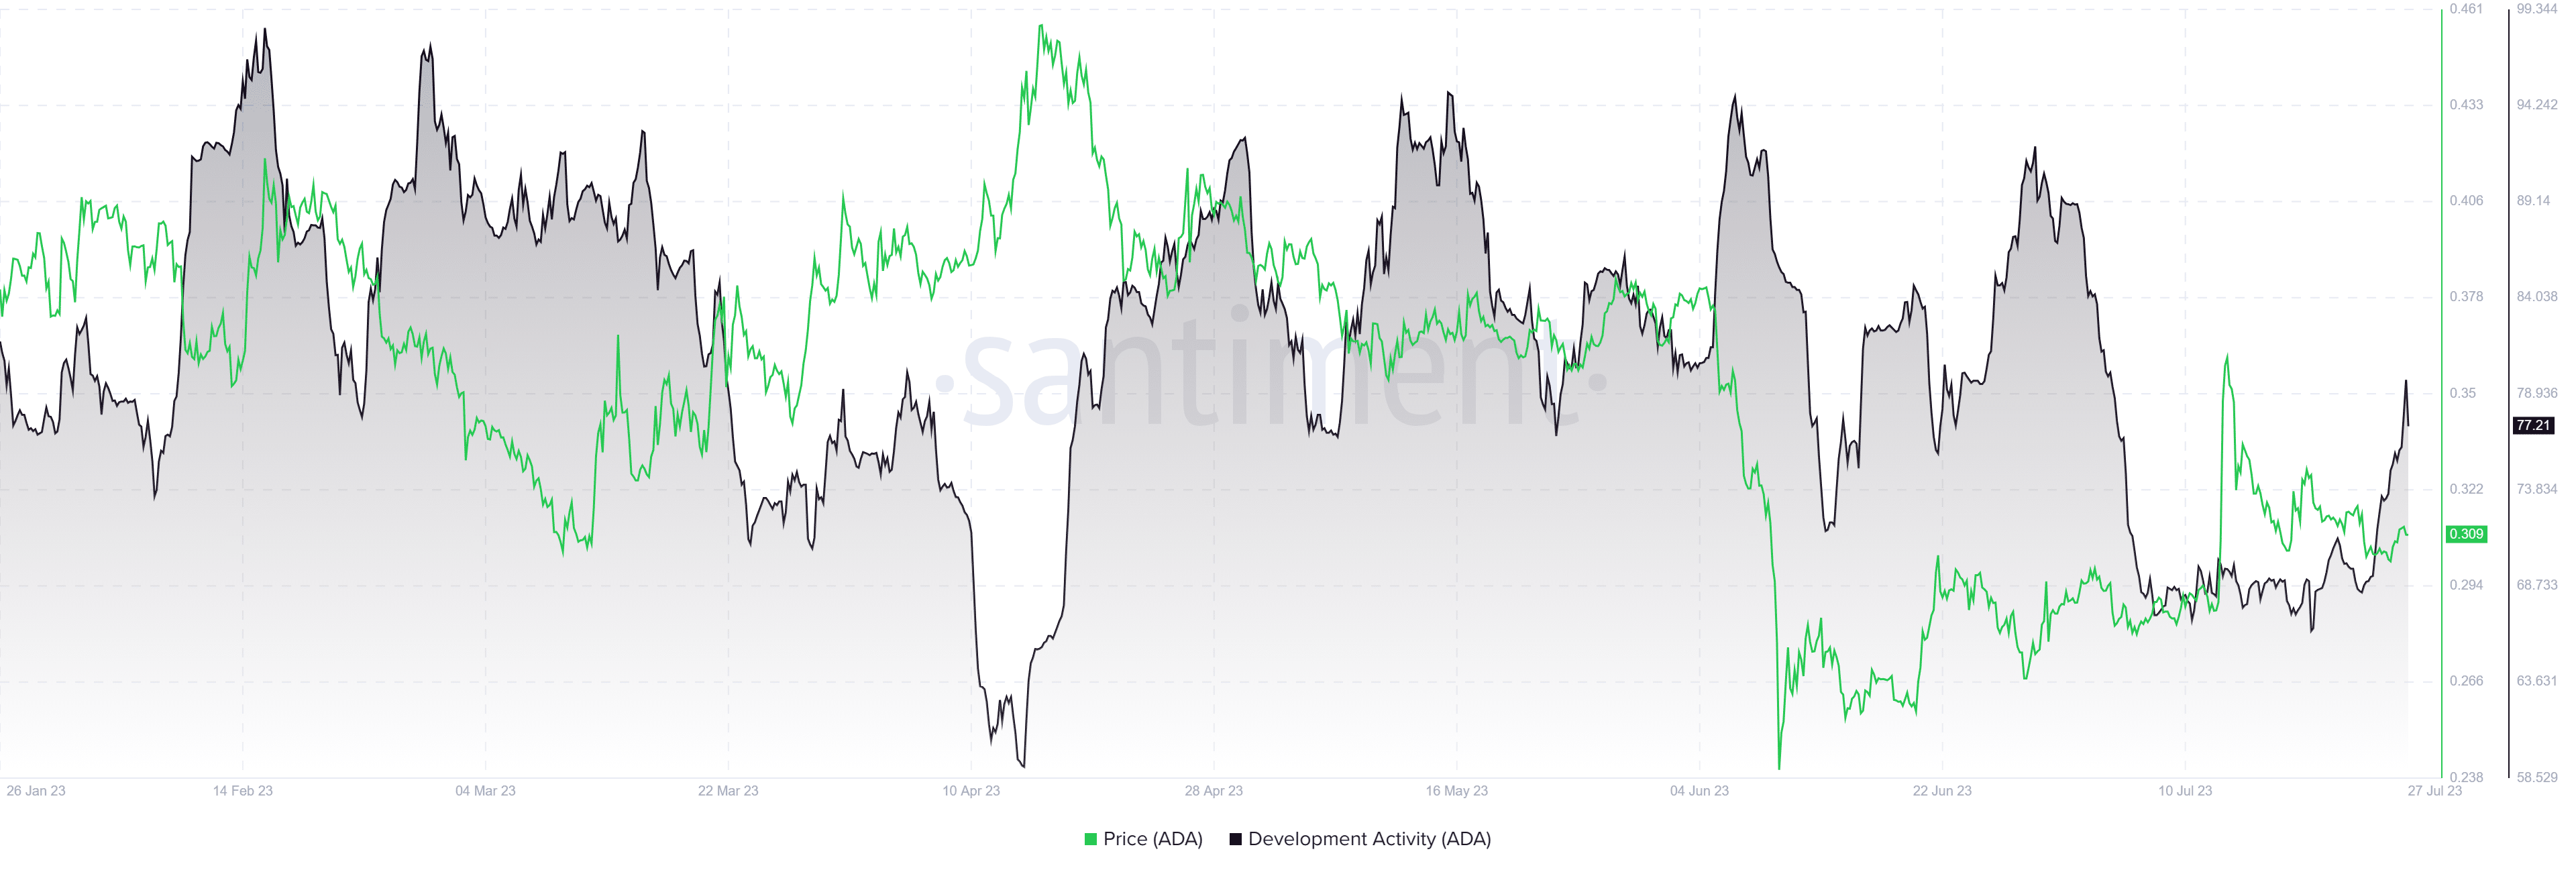
Nevertheless, the overall outlook remains bullish for Cardano price, with Santiment feed showing that ADA ranks third in development activity. The performance is commendable, with the crypto asset beating Ethereum (ETH), the largest altcoin on market capitalization metrics.
DOT is doing equally well, leading the pack of ten, as the community members attribute the success to Polkadot’s focus on multichain, one of the most advanced and robust technologies on the blockchain. This explains why the likes of Polygon (MATIC), Cosmos (ATOM), Ethereum (ETH), Enjin Coin (ENJ), GameSwift (GSWIFT), and Celestial (CELT) are copying Polkadot’s principles.
Notably, the Cardano network’s development activity has recorded several peaks in the year already, as indicated in the chart below. Since April 14, development activity is up 30%, rising from 59.01 to 77.21 as of July 27.
ADA Network Development Activity Source: Santiment
The metric shows the number of pure development-related events in the project’s public GitHub repository.
Cardano price forecast
Based on the daily chart above for the ADA/USDT trading pair, Cardano price could break out from the technical formation if bullish momentum continues in the ADA market. A successful breach of the 50-day Exponential Moving Average (EMA) at $0.30 could clear the path for ADA to breach the upper boundary of the triangle pattern to tag the 100-day EMA at $0.32.
In a highly bullish case, Cardano price could extend north to tag the resistance confluence between the horizontal line and the 200-day EMA at $0.35. Such a move would constitute a 15% climb from the current position.
On the flip side, if momentum wanes, Cardano price could break out to the downside, breaching the triangle’s lower boundary and potentially extending south to tag the July 7 lows around $0.27. This would denote a 10% slump from the current price.
With both momentum indicated at midrange (RSI and AO), investors should wait for confirmation, indicated by a decisive breakout from the triangle pattern.
Like this article? Help us with some feedback by answering this survey:


