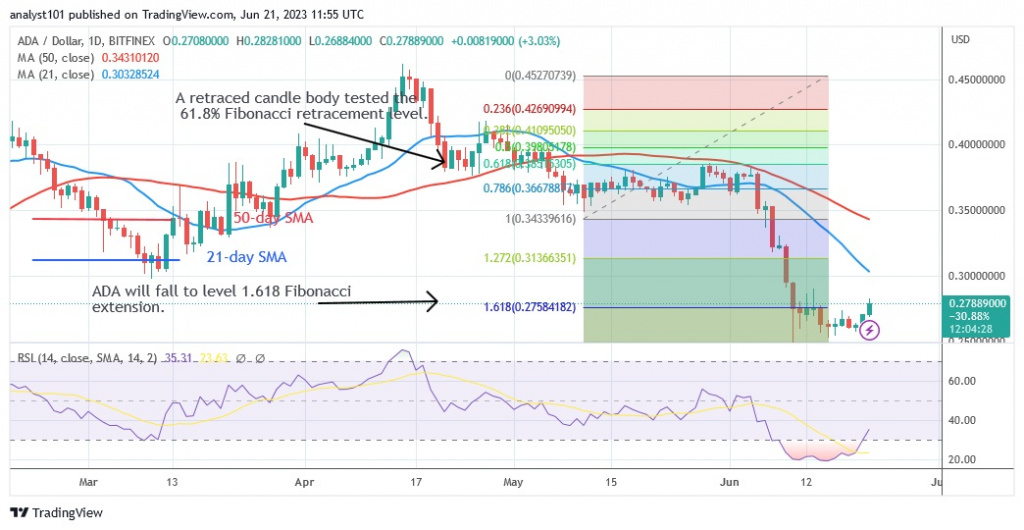
The price of Cardano (ADA) has been moving sideways after the price drop on June 10.
Cardano price long-term forecasts: bearish
The cryptocurrency fell to a low of $0.22, but the bulls bought the dips. As Cardano resumed its rise above the $0.25 support, the selling pressure eased.
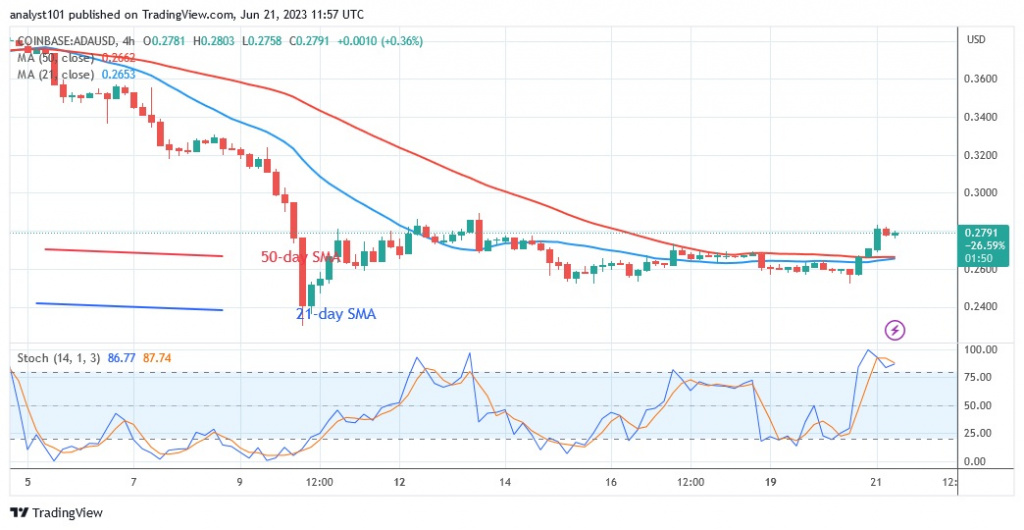
Since June 10, the ADA price has hovered between $0.25 and $0.28. Price activity was defined by a small indecisive candle known as a doji. Price action was limited due to the presence of doji candlesticks. At the time of writing, ADA /USD had risen to a high of $0.27. The current positive momentum is likely to fade as the market approaches overbought territory.
Cardano indicator analysis
Cardano is in an uptrend and exceeds the Relative Strength Index of 35 for the period 14. Being in a downtrend, the altcoin has the potential to fall. The price bars are below the moving average, indicating a possible downtrend. The altcoin has moved up into an overbought region of the market. It is above the daily stochastic level of 80.

Technical Indicators
Key resistance zones: $0.30, $0.35, $0.40
Key support zones: $0.20, $0.15, $0.10
What is the next move for Cardano?
Cardano has reached a high of $0.28, but this high has been rejected. This means that the price of the altcoin is limited to a range of $0.25 to $0.28. Currently, the altcoin is expected to fall due to the rejection in the overbought zone. Once the limits of the trading range are broken, the altcoin will develop a trend.

Disclaimer. This analysis and forecast are the personal opinions of the author and are not a recommendation to buy or sell cryptocurrency and should not be viewed as an endorsement by CoinIdol. Readers should do their own research before investing in funds.


