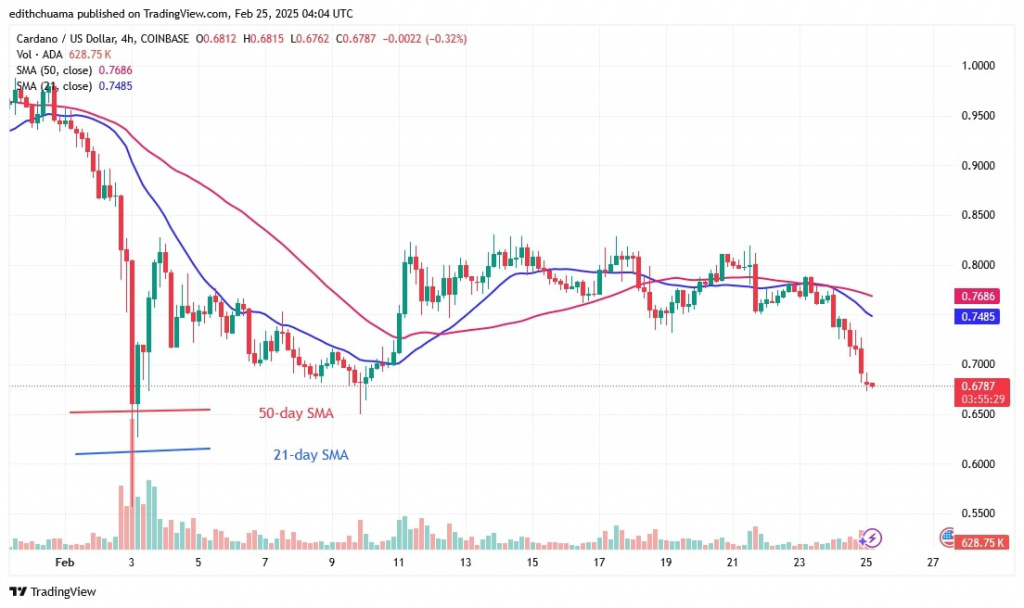
The price of Cardano (ADA) fell to the current support level of $0.65 on February 24. Since then, however, it has been moving sideways.
Long-term forecast for the Cardano price: bearish
Buyers have been working feverishly since February 13 to keep the price above the 21-day SMA barrier. After three retests of the 21-day SMA barrier, ADA’s price fell, as reported by Coinidol.com. The current support of $0.65 was reached by the bearish momentum.
However, if Cardano loses the current support at $0.65, the price will fall to the low of $0.50. If the bulls hold the current support at $0.65, the range-bound move will continue and the value of the cryptocurrency will rise if the buyers keep the price above the 21-day SMA.
ADA indicator analysis
Cardano has fallen after being rejected at the 21-day SMA level.
The bulls were unable to break above the 21-day SMA barrier last week. Cardano fell because the price bars were below the moving average lines. The moving average lines remain horizontal despite the decline.
Technical Indicators
Key Resistance Zones: $1.20, $1.30, and $1.40
Key Support Zones: $0.90, $0.80, and $0.70

What is the next move for Cardano?
Cardano is falling on the 4-hour chart after the recent rejection at the 21-day SMA. The altcoin has fallen to its current support level of $0.65 and selling pressure has paused above it. The altcoin is now consolidating above the $0.65 support level, suggesting that the cryptocurrency could be on the upswing.

Disclaimer. This analysis and forecast are the personal opinions of the author. They are not a recommendation to buy or sell cryptocurrency and should not be viewed as an endorsement by Coin Idol. Readers should do their research before investing in funds.


