The price of Cardano (ADA) has fallen below the moving average lines.
Long-term forecast for the Cardano price: bearish
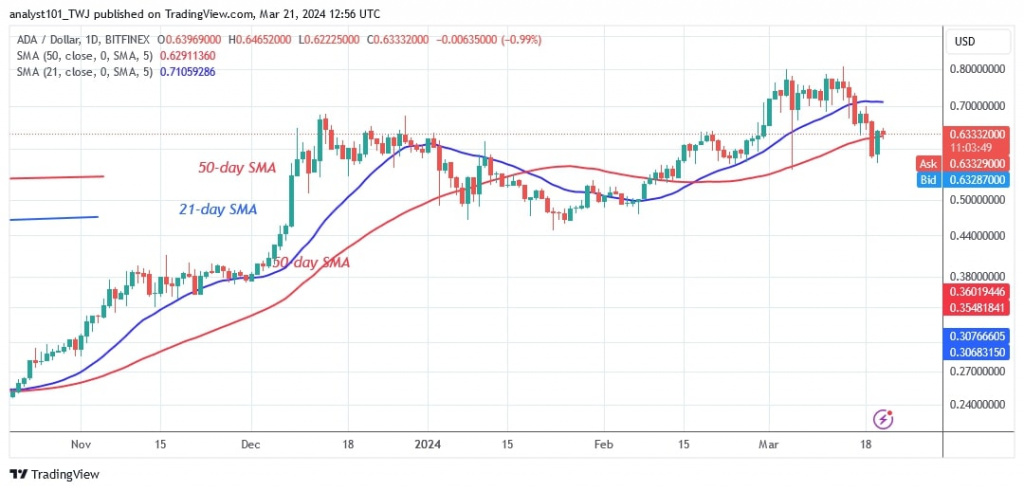
The rejection of the overhead resistance of $0.80 forced the ADA price to fall below the moving average lines. The crypto price fell from a high of $0.80 to a low of $0.58. The bulls bought the dips as the altcoin regained its bullish momentum. The buyers kept the price above the 50-day SMA but the upside momentum stalled there.
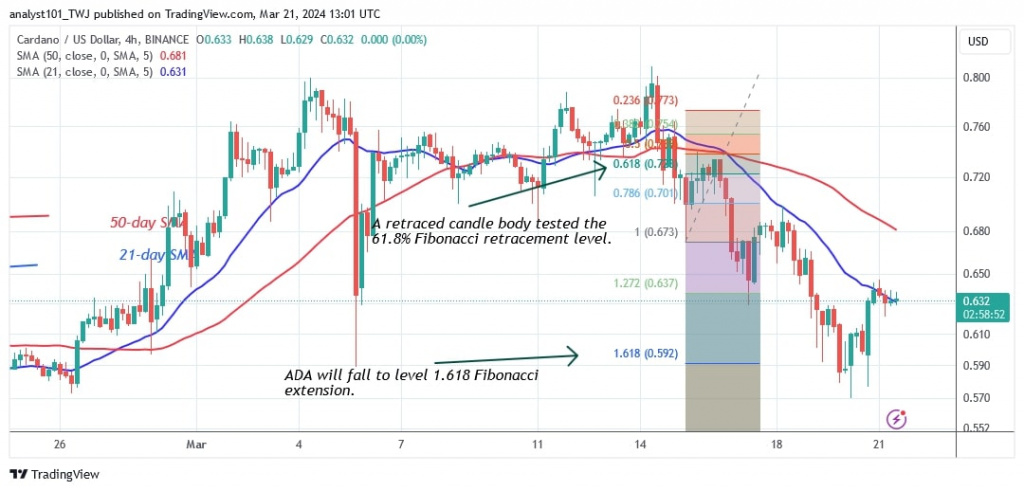
Cardano is bearish again after reaching resistance at $0.64. Further upward movement of the coin is unlikely. On the downside, the ADA price will decline and return to its previous low above $0.58. At the time of writing, Cardano is currently worth $0.63
Analysis of the Cardano indicators
Following the current decline, Cardano price bars have fallen below the moving average lines. However, selling pressure has eased above the $0.58 support. Doji candlesticks have slowed the price movement. Despite the recent decline, the moving average lines are pointing upwards.
Technical indicators
Key resistance zones: $0.50, $0.55, $0.60
Key support zones: $0.30, $0.25, $0.20
What is the next move for Cardano?
Cardano’s slide has stalled above the $0.58 support level and the altcoin has corrected upwards. The 4-hour chart shows that the ADA price is bouncing back and forth between the current support at $0.58 and the high at $0.64 or the 21-day SMA. The upward movement is currently being halted by the 21-day SMA resistance. Doji candlesticks are forming below the resistance level.

Disclaimer. This analysis and forecast are the personal opinions of the author and are not a recommendation to buy or sell cryptocurrency and should not be viewed as an endorsement by CoinIdol.com. Readers should do their research before investing in funds.


