The price of Cardano (ADA) has continued to move sideways, trying to break above the moving average lines.
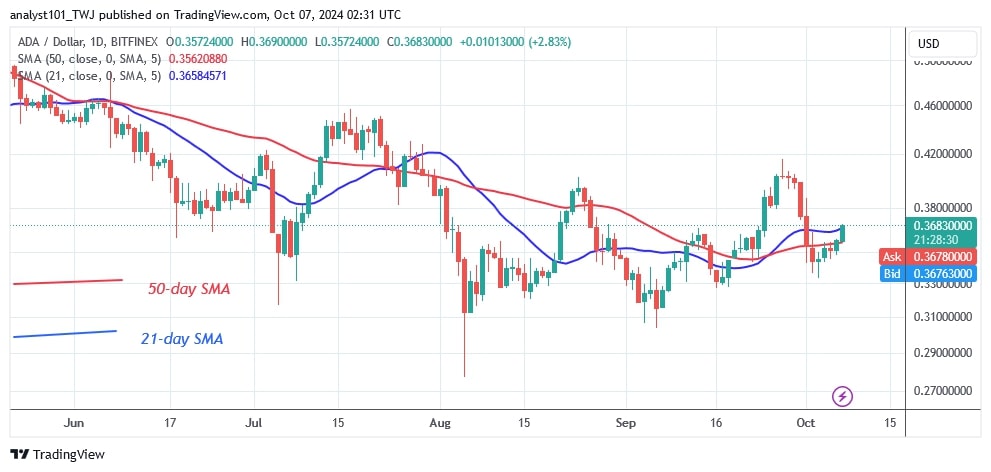
Cardano has been trading sideways for two months, fluctuating between the $0.30 support and the $0.40 resistance, as reported by Coinidol.com. The bulls have retested the barrier twice but have been unable to establish a positive trend.
ADA price long-term prediction: ranging
Today, the altcoin is trying to retest or break through the resistance for the third time. If the buyers break the resistance at $0.40, ADA price will rise to highs of $0.45 and $0.50. If the bullish situation is invalidated, the market will continue to trade in a range.
However, the downtrend will continue if the support level of $0.30 is broken. Cardano is currently worth $0.366.
Analysis of the Cardano price indicators
The ADA price has risen above the moving average lines but was stopped by the 21-day SMA on the daily chart. The uptrend will continue if the price breaks above the 21-day SMA. The altcoin is rising and is facing resistance at $0.40. The sideways trend is causing the moving average lines to drop horizontally.
Technical Indicators
Key Resistance Zones: $0.80, $0.85, and $0.90
Key Support Zones: $0.50, $0.45, and $0.40
What is the next move for Cardano?
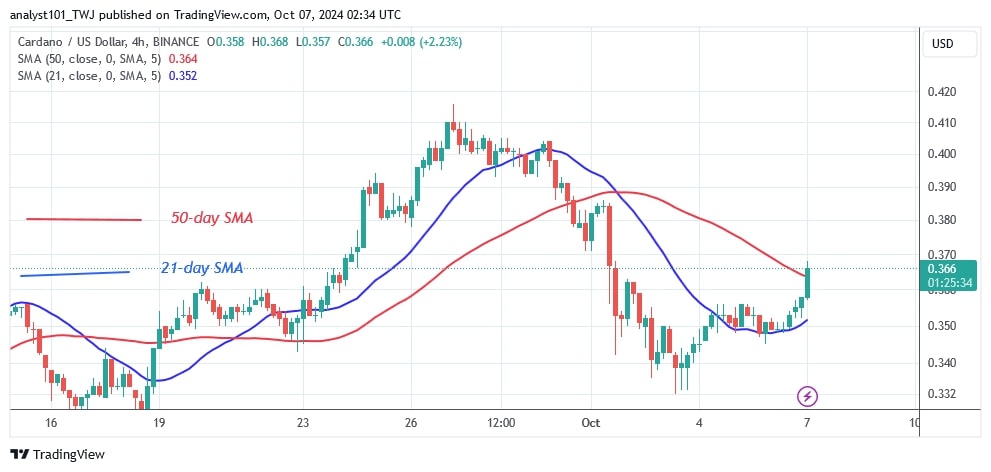
Cardano is trading sideways between $0.30 and $0.40. The altcoin has failed to resume a positive trend due to resistance at $0.40. Currently, the price of the cryptocurrency is locked between the moving average lines but the bullish momentum has broken above the 50-day SMA on the 4-hour chart. The ADA price is expected to rise to a high of $0.40.

Disclaimer. This analysis and forecast are the personal opinions of the author. They are not a recommendation to buy or sell cryptocurrency and should not be viewed as an endorsement by CoinIdol.com. Readers should do their research before investing in funds.


