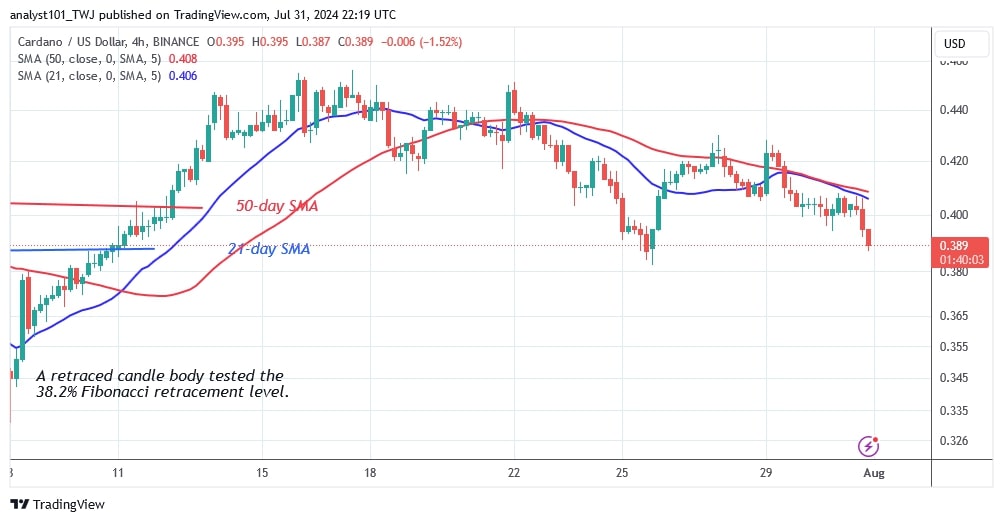
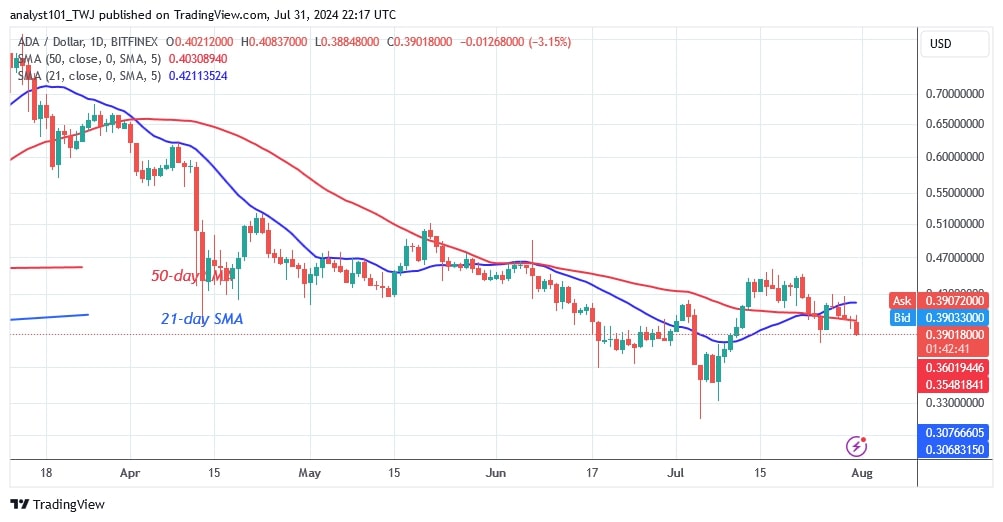
The price of Cardano (ADA) has fallen below the moving average lines again after rejecting the high at $0.456. Price analysis by Coinidol.com.
Cardano price long-Term forecast: bearish
On July 13, buyers wanted to continue the positive trend by keeping the price above the moving average lines. For more than a week, the price of the cryptocurrency fluctuated below the resistance zone of $0.46, but was unable to overcome it.
Cardano was pushed back on July 22, as reported before by Coinidol.com, and fell below the moving average lines. The altcoin resumed selling pressure after the upward correction ended. If the cryptocurrency is below the moving average lines, it is likely to fall even further. The price indicator shows that the price of ADA will fall to $0.338.
ADA indicator analysis
After today’s fall, the price bars are below the moving average lines. Since April 13, when the trend was sideways, the moving average lines have remained horizontal. The altcoin is declining and approaching the previous low of $0.31.
Technical Indicators
Key Resistance Zones: $0.80, $0.85, and $0.90
Key Support Zones: $0.50, $0.45, and $0.40
What is the next move for Cardano?
The 4-hour chart shows a steady decline in Cardano’s price. The selling pressure eased after hitting a low of $0.368. The retraction suggests that ADA may be headed for a fall.
Cardano is predicted to drop even lower, reaching a low of $0.338.The cryptocurrency signal is still negative in the interim.

Disclaimer. This analysis and forecast are the personal opinions of the author. They are not a recommendation to buy or sell cryptocurrency and should not be viewed as an endorsement by CoinIdol.com. Readers should do their research before investing in funds.


