Cardano (ADA) price rises as it breaks through the moving average lines, but it remains below the 50-day SMA.
Cardano price long-term forecasts: bearish
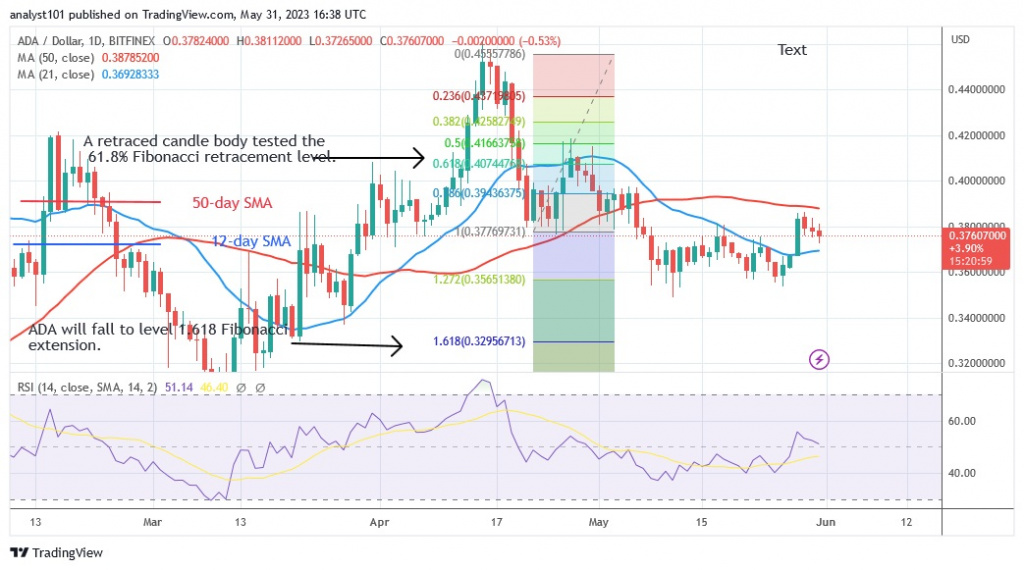
In other words: After the recent rise, Cardano is trapped between the moving average lines. At the time of writing, Cardano is at $0.37. Cardano is expected to lose value based on the price indication. According to the tool analysis, the cryptocurrency will continue to fall until it reaches the 1.618 level of the Fibonacci extension or the $0.32 level. Cardano is trying to rise above the moving average lines based on the price activity. On the positive side, the uptrend will resume if the upward momentum is maintained above the moving average lines. The price of ADA will rise and regain its previous high of $0.46.
Cardano indicator analysis
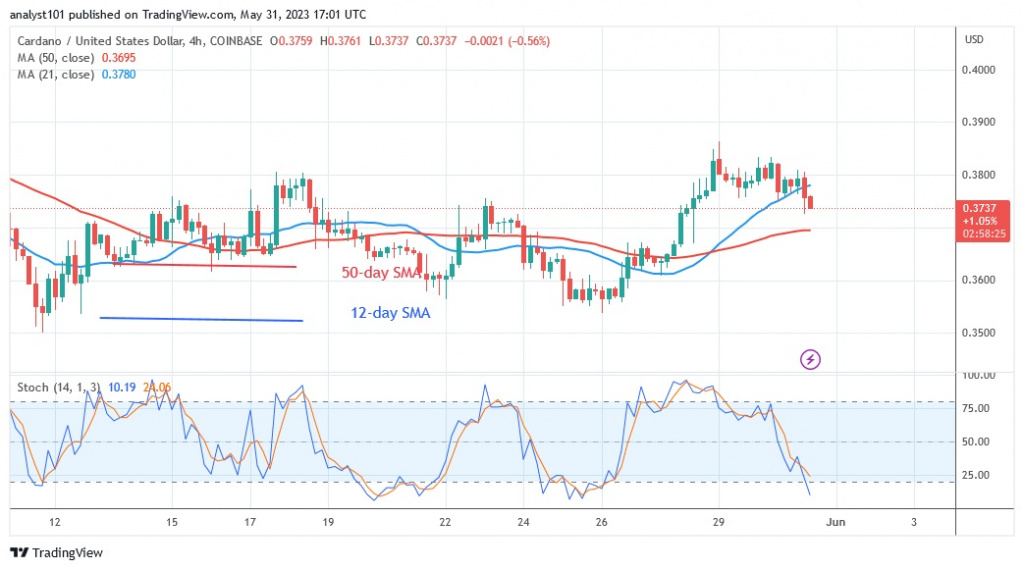
Thanks to the current price rally, Cardano has climbed to the 50 level on the Relative Strength Index for the 14 period. The price bars are currently between the moving average lines, suggesting that the cryptocurrency might be moving in a range. The cryptocurrency is moving below the 25 level of the daily stochastic, which is a bearish sign. Selling pressure will intensify if the price falls below the moving average lines.

Technical Indicators
Key resistance zones: $0.50, $0.60, $0.70
Key support zones: $0.30, $0.20, $0.10
What is the next move for Cardano?
Cardano will be forced to move in a range as the price bars between the moving average lines. The altcoin will develop a trend when the moving average lines are broken. The recent upward momentum is rejected at the high of $0.3850.

Disclaimer. This analysis and forecast are the personal opinions of the author and are not a recommendation to buy or sell cryptocurrency and should not be viewed as an endorsement by CoinIdol. Readers should do their own research before investing in funds.


