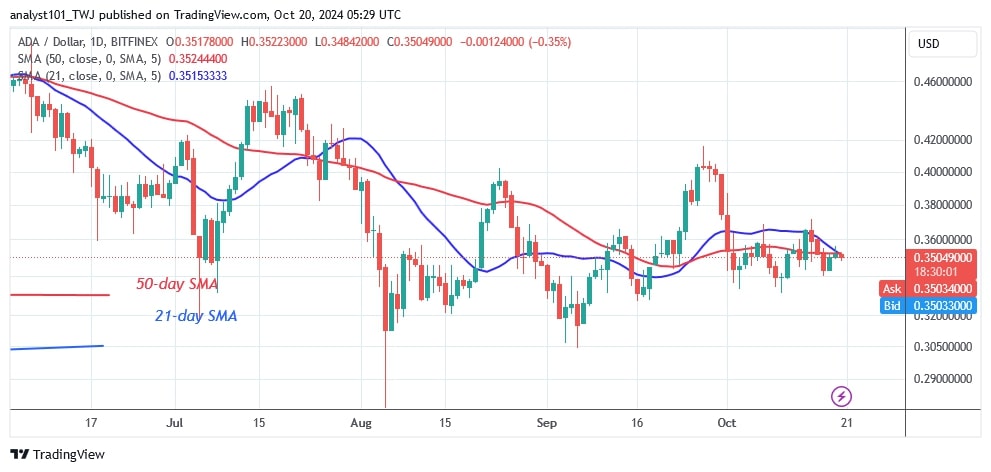
The price of Cardano (ADA) has been moving sideways and has fallen below the moving average lines.
Long-term forecast for the Cardano price: randing
Previously, the altcoin’s price range was $0.30 to $0.40. Today, the sideways movement is limited to $0.30 to $0.36, below the moving average lines or resistance levels.
On October 7 and 15, the buyers tried to keep the price above the moving average lines, but were unsuccessful, as Coinidol.com wrote previously. The ADA price fell to a low of $0.33, but recovered again. The cryptocurrency is trading in a limited range below the moving average lines. If Cardano loses its current support, it will fall back to the previous low of $0.30.
Cardano indicator analysis
The price bars are below the moving average lines as the altcoin is trading in a limited range. The ADA price is moving within a limited range. The moving averages are sloping horizontally, with a bearish crossover. The altcoin could fall to a low of $0.30.
Technical Indicators
Key Resistance Zones: $0.80, $0.85, and $0.90
Key Support Zones: $0.50, $0.45, and $0.40
What is the next move for Cardano?
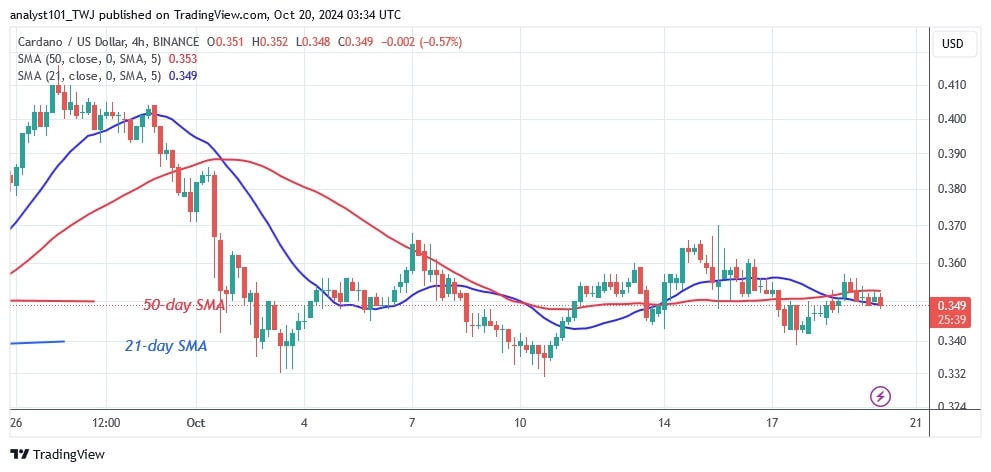
On the 4-hour chart, Cardano has been moving sideways since October 3. The altcoin is trading between $0.33 and $0.36. However, the price bars are moving both below and above the moving average lines. Doji candlesticks dominate Cardano’s price action as they remain range-bound.
Disclaimer. This analysis and forecast are the personal opinions of the author. They are not a recommendation to buy or sell cryptocurrency and should not be viewed as an endorsement by CoinIdol.com. Readers should do their research before investing in funds.


