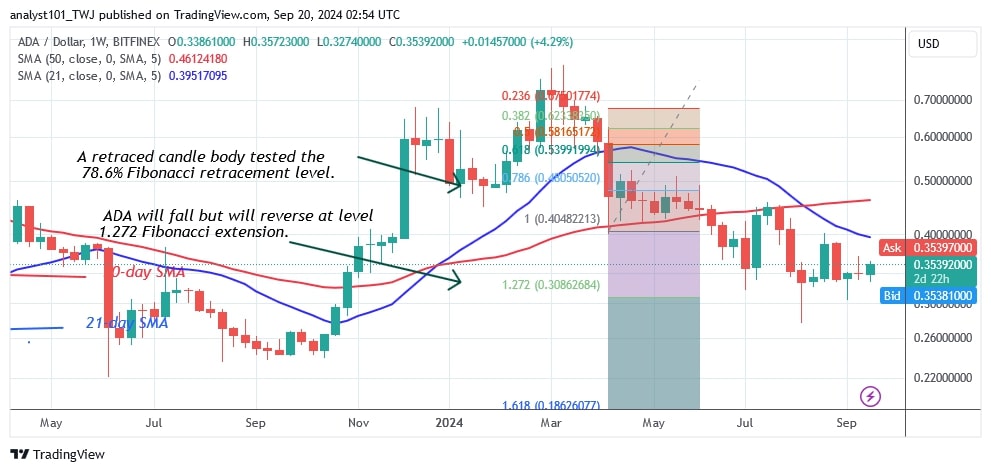
The price of Cardano (ADA) has held above $0.30 thanks to a sideways trend after the price drop on August 5. The cryptocurrency is stable above the $0.30 support but below the moving average lines or the $0.40 resistance level.
Cardano price long term forecast: ranging
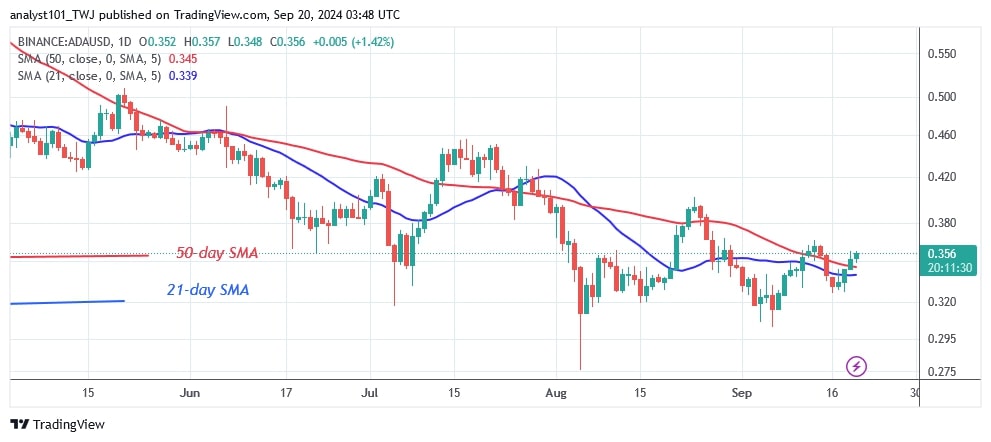
Although the downtrend has been halted, the upward momentum is being held back by the moving average lines and resistance at $0.40. On the daily chart, the price of the cryptocurrency has risen above the moving average lines but is now facing early resistance at $0.36.
If the buyers sustain the price above the moving average lines or the resistance at $0.40, Cardano will rise to a high of $0.50. Bearish momentum has waned and a sideways trend could continue if the bulls fail to break through the barriers. Cardano is currently worth $0.356.
Analysis of the Cardano indicators
The ADA price rises when it breaks above the moving average lines of the daily chart. The upward movement was hindered by the resistance at $0.36. The sideways movement will continue as the altcoin encounters early resistance at $0.36. The moving average lines are running below and above the moving average lines, indicating a sideways trend.
Technical Indicators
Key Resistance Zones: $0.80, $0.85, and $0.90
Key Support Zones: $0.50, $0.45, and $0.40
What is the next move for ADA?
Cardano is in a rangebound movement after the end of the downtrend on August 5, as reported by Coinidol.com previously. Buyers have worked tirelessly over the past month to keep the price above the moving average lines or the barrier at $0.40.
However, the possibility of an upward move has been rejected as the sideways trend continues. Should the bears break the current support of $0.30, the altcoin would fall to its previous low of $0.27.

Disclaimer. This analysis and forecast are the personal opinions of the author. They are not a recommendation to buy or sell cryptocurrency and should not be viewed as an endorsement by CoinIdol.com. Readers should do their research before investing in funds.


