The latest price analysis by Coinidol.com report, Cardano (ADA) price is falling below the moving average lines.
Cardano price long-term forecasts: bearish
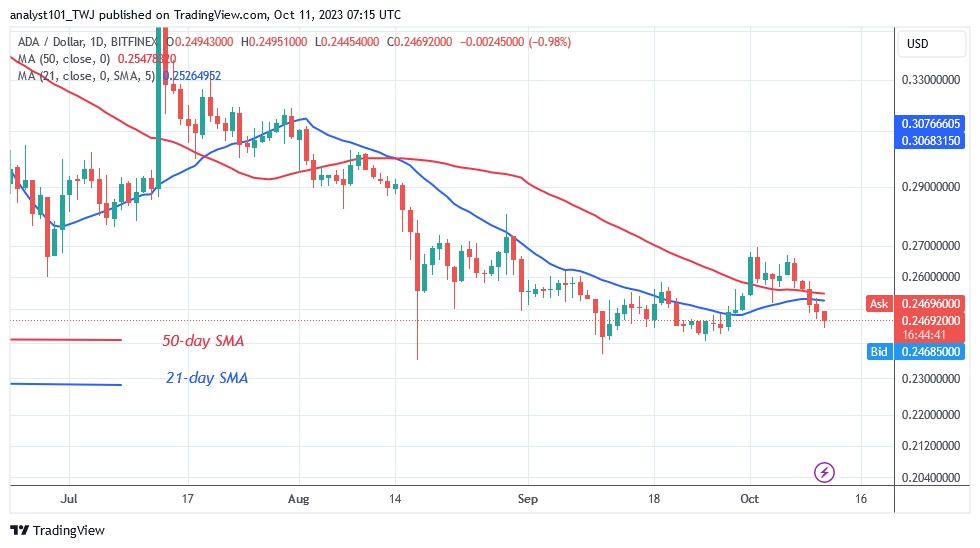
The deterioration has continued outside the range where the price is. After a strong rejection at the high of $0.265, the ADA price is currently trading around $0.246. The cryptocurrency value moved between $0.24 and $0.27 in the previous price action.
The bears are aiming to break the lower price range to the downside. However, if the bears manage to break the $0.24 support, ADA will drop much lower to its previous low of $0.235 or $0.236. The altcoin will recover and continue its movement within the trading range if the current downtrend ends above the $0.24 support. The altcoin is currently trading above the $0.246 support.
Cardano indicator analysis
The moving average lines are below the price bars, indicating that the cryptocurrency asset is in a bearish trend zone. When the cryptocurrency price is below the moving average lines, ADA tends to decline. However, as the market has entered an oversold zone, the selling pressure decreases.

Technical indicators
Key resistance zones: $0.30, $0.35, $0.40
Key support zones: $0.20, $0.15, $0.10
What is the next move for Cardano?
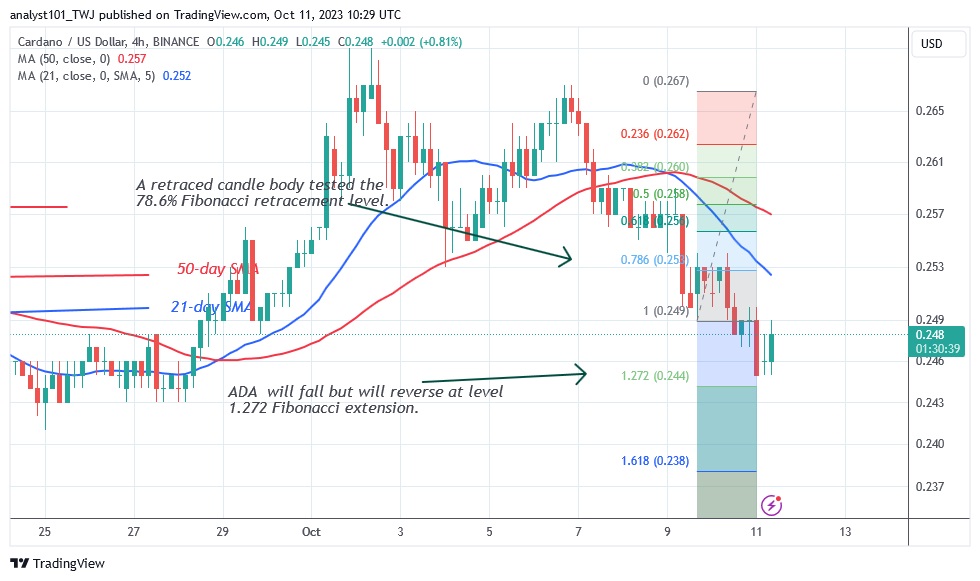
The 4-hour chart of Cardano shows that the price is declining. According to the price indication, ADA will decline but turn around at the 1.272 Fibonacci extension level or $0.244. Based on the price movement, Cardano fell to a low of $0.245 before rebounding. The altcoin is currently trading at $0.248. The cryptocurrency’s price is once again range-bound.

As we reported on October 4, the altcoin rose to a high of $0.27 on October 2, but encountered resistance. The market is overbought near the recent high.
Disclaimer. This analysis and forecast are the personal opinions of the author and are not a recommendation to buy or sell cryptocurrency and should not be viewed as an endorsement by CoinIdol.com. Readers should do their research before investing in funds.


