Bitcoin’s price is undergoing increased volatility fueled by the SEC-ETF controversy and a false SEC tweet announcing ETF approval.
However, the price encounters a significant resistance zone, and a breakthrough will possibly initiate a robust upward trend, aiming for new ATHs in 2024.
Technical Analysis
By Shayan
The Daily Chart
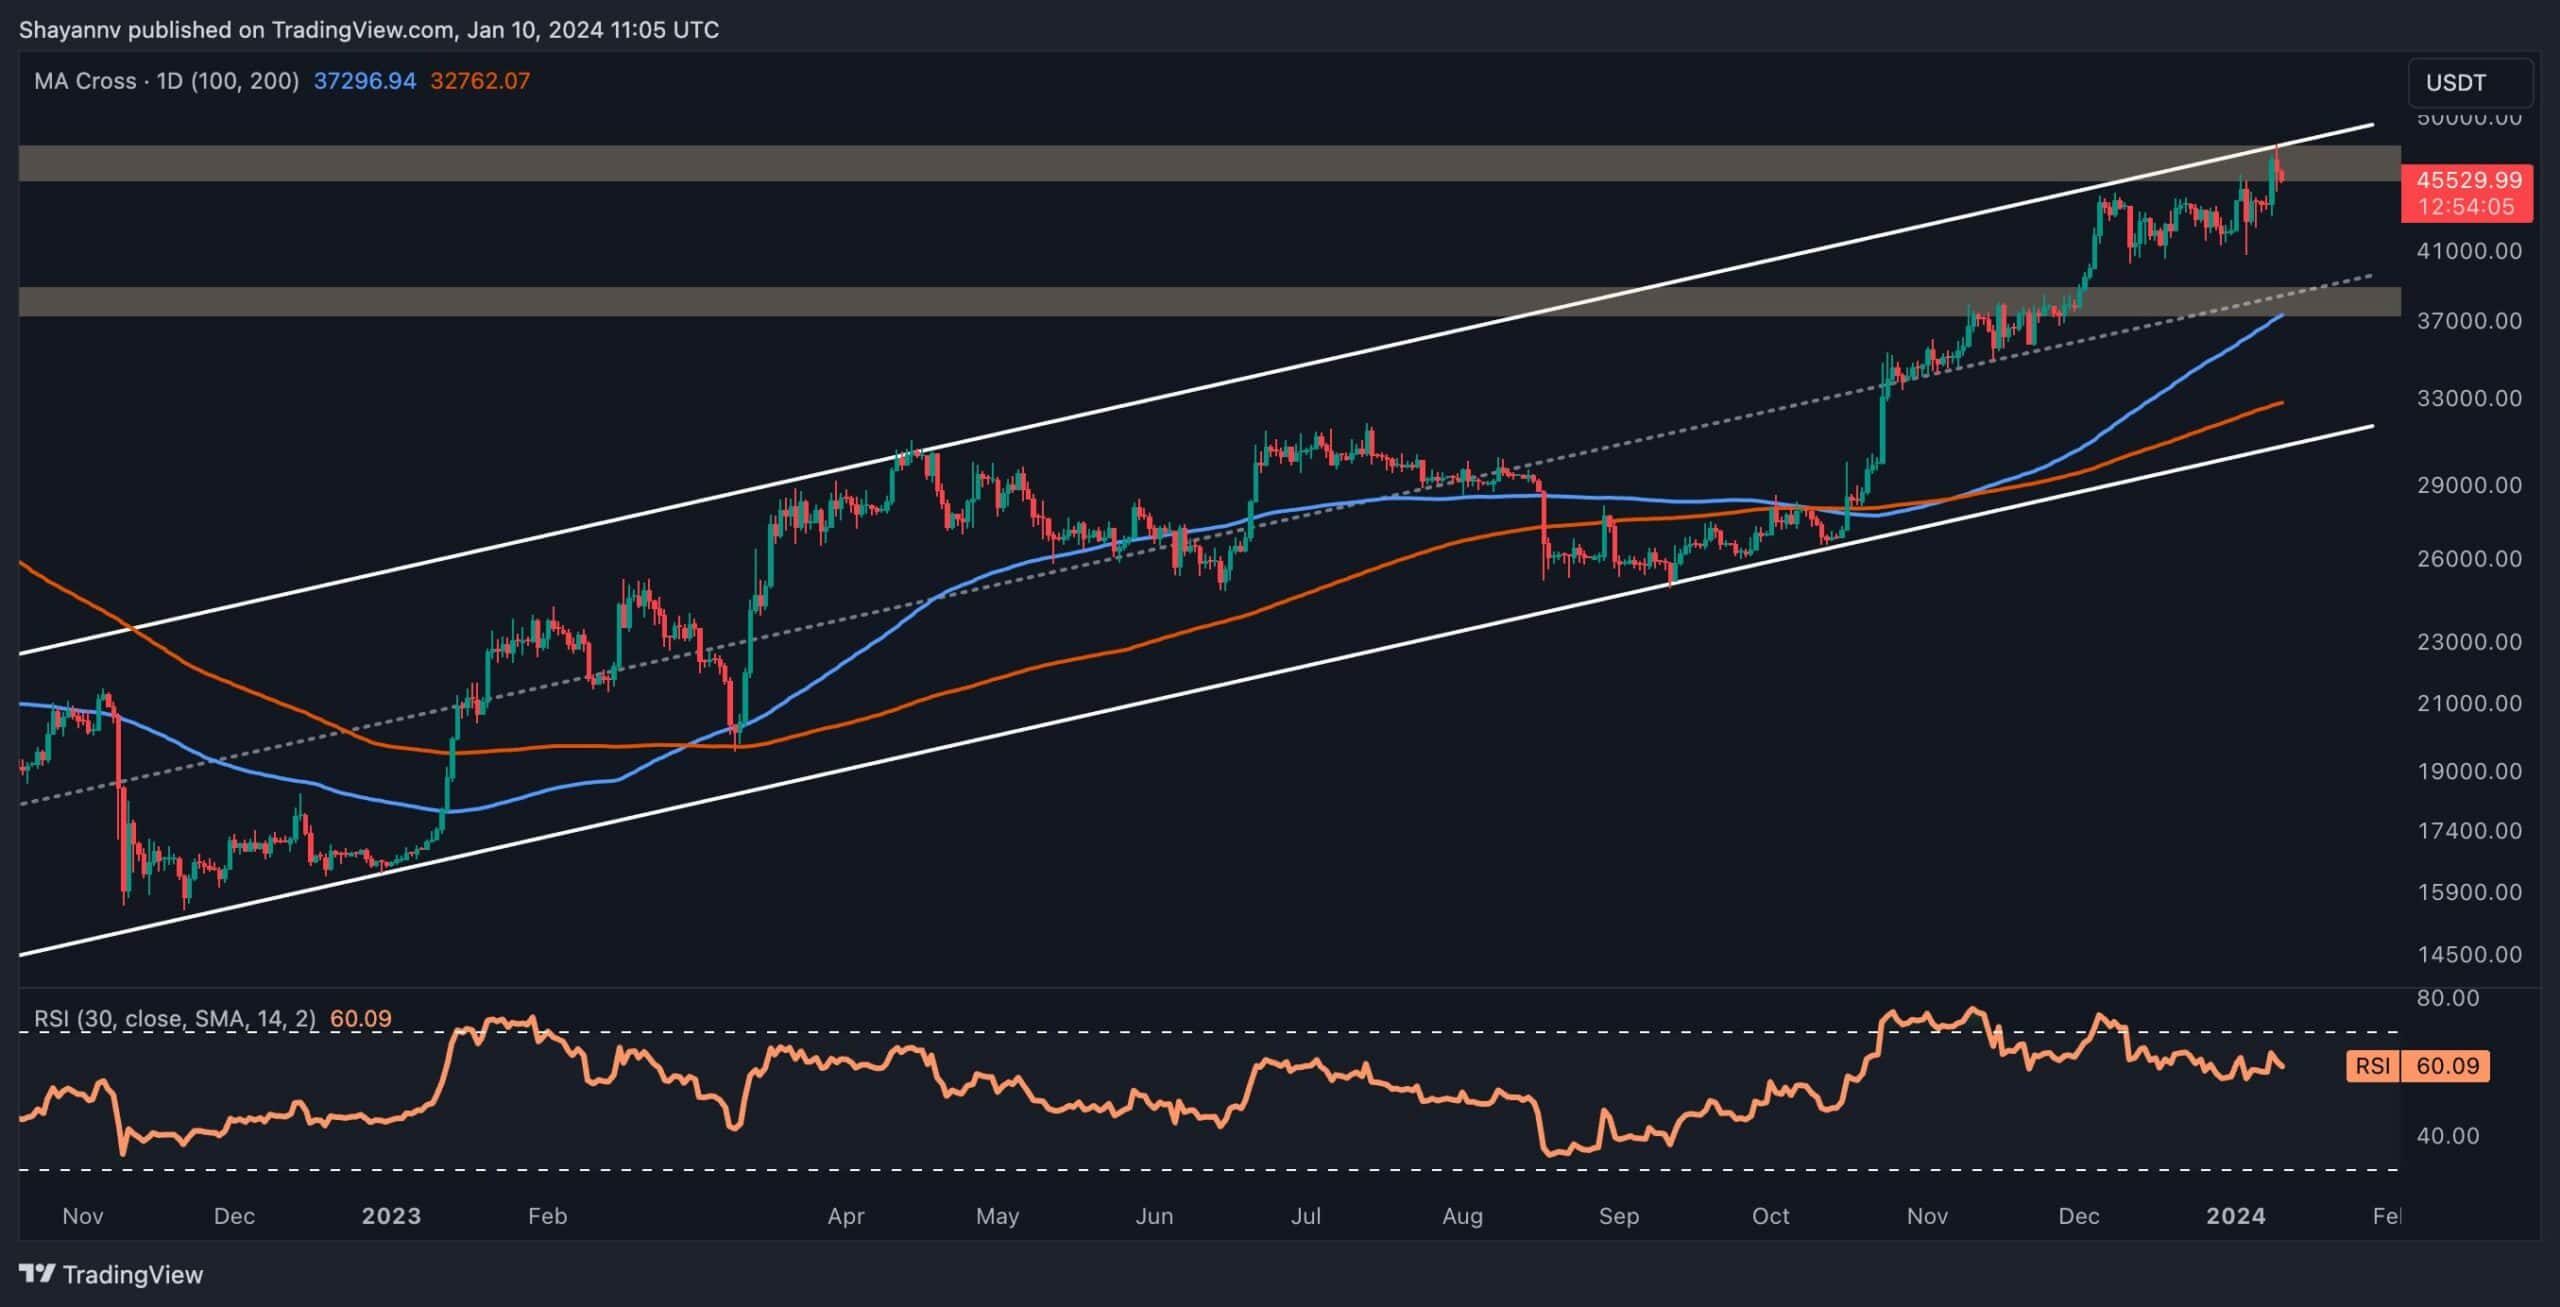
A thorough examination of the daily chart reveals Bitcoin’s prolonged uptrend since January 2023, forming higher highs and higher lows within an evident ascending price channel. This pattern signifies buyer dominance and a healthy bull market.
Despite the positive trend, recent heightened volatility resulted from a false SEC tweet announcing the approval of the first Bitcoin spot ETF. This led to notable price fluctuations, bringing the price close to a substantial resistance area. This resistance region includes the upper trendline of the ascending channel, coinciding with the $48K significant resistance.
A successful breakthrough in this critical area could trigger a profound uptrend, potentially reaching a new all-time high (ATH) for Bitcoin. The formal announcement of ETF approval, if made, would further catalyze the price towards higher levels.

The 4-Hour Chart
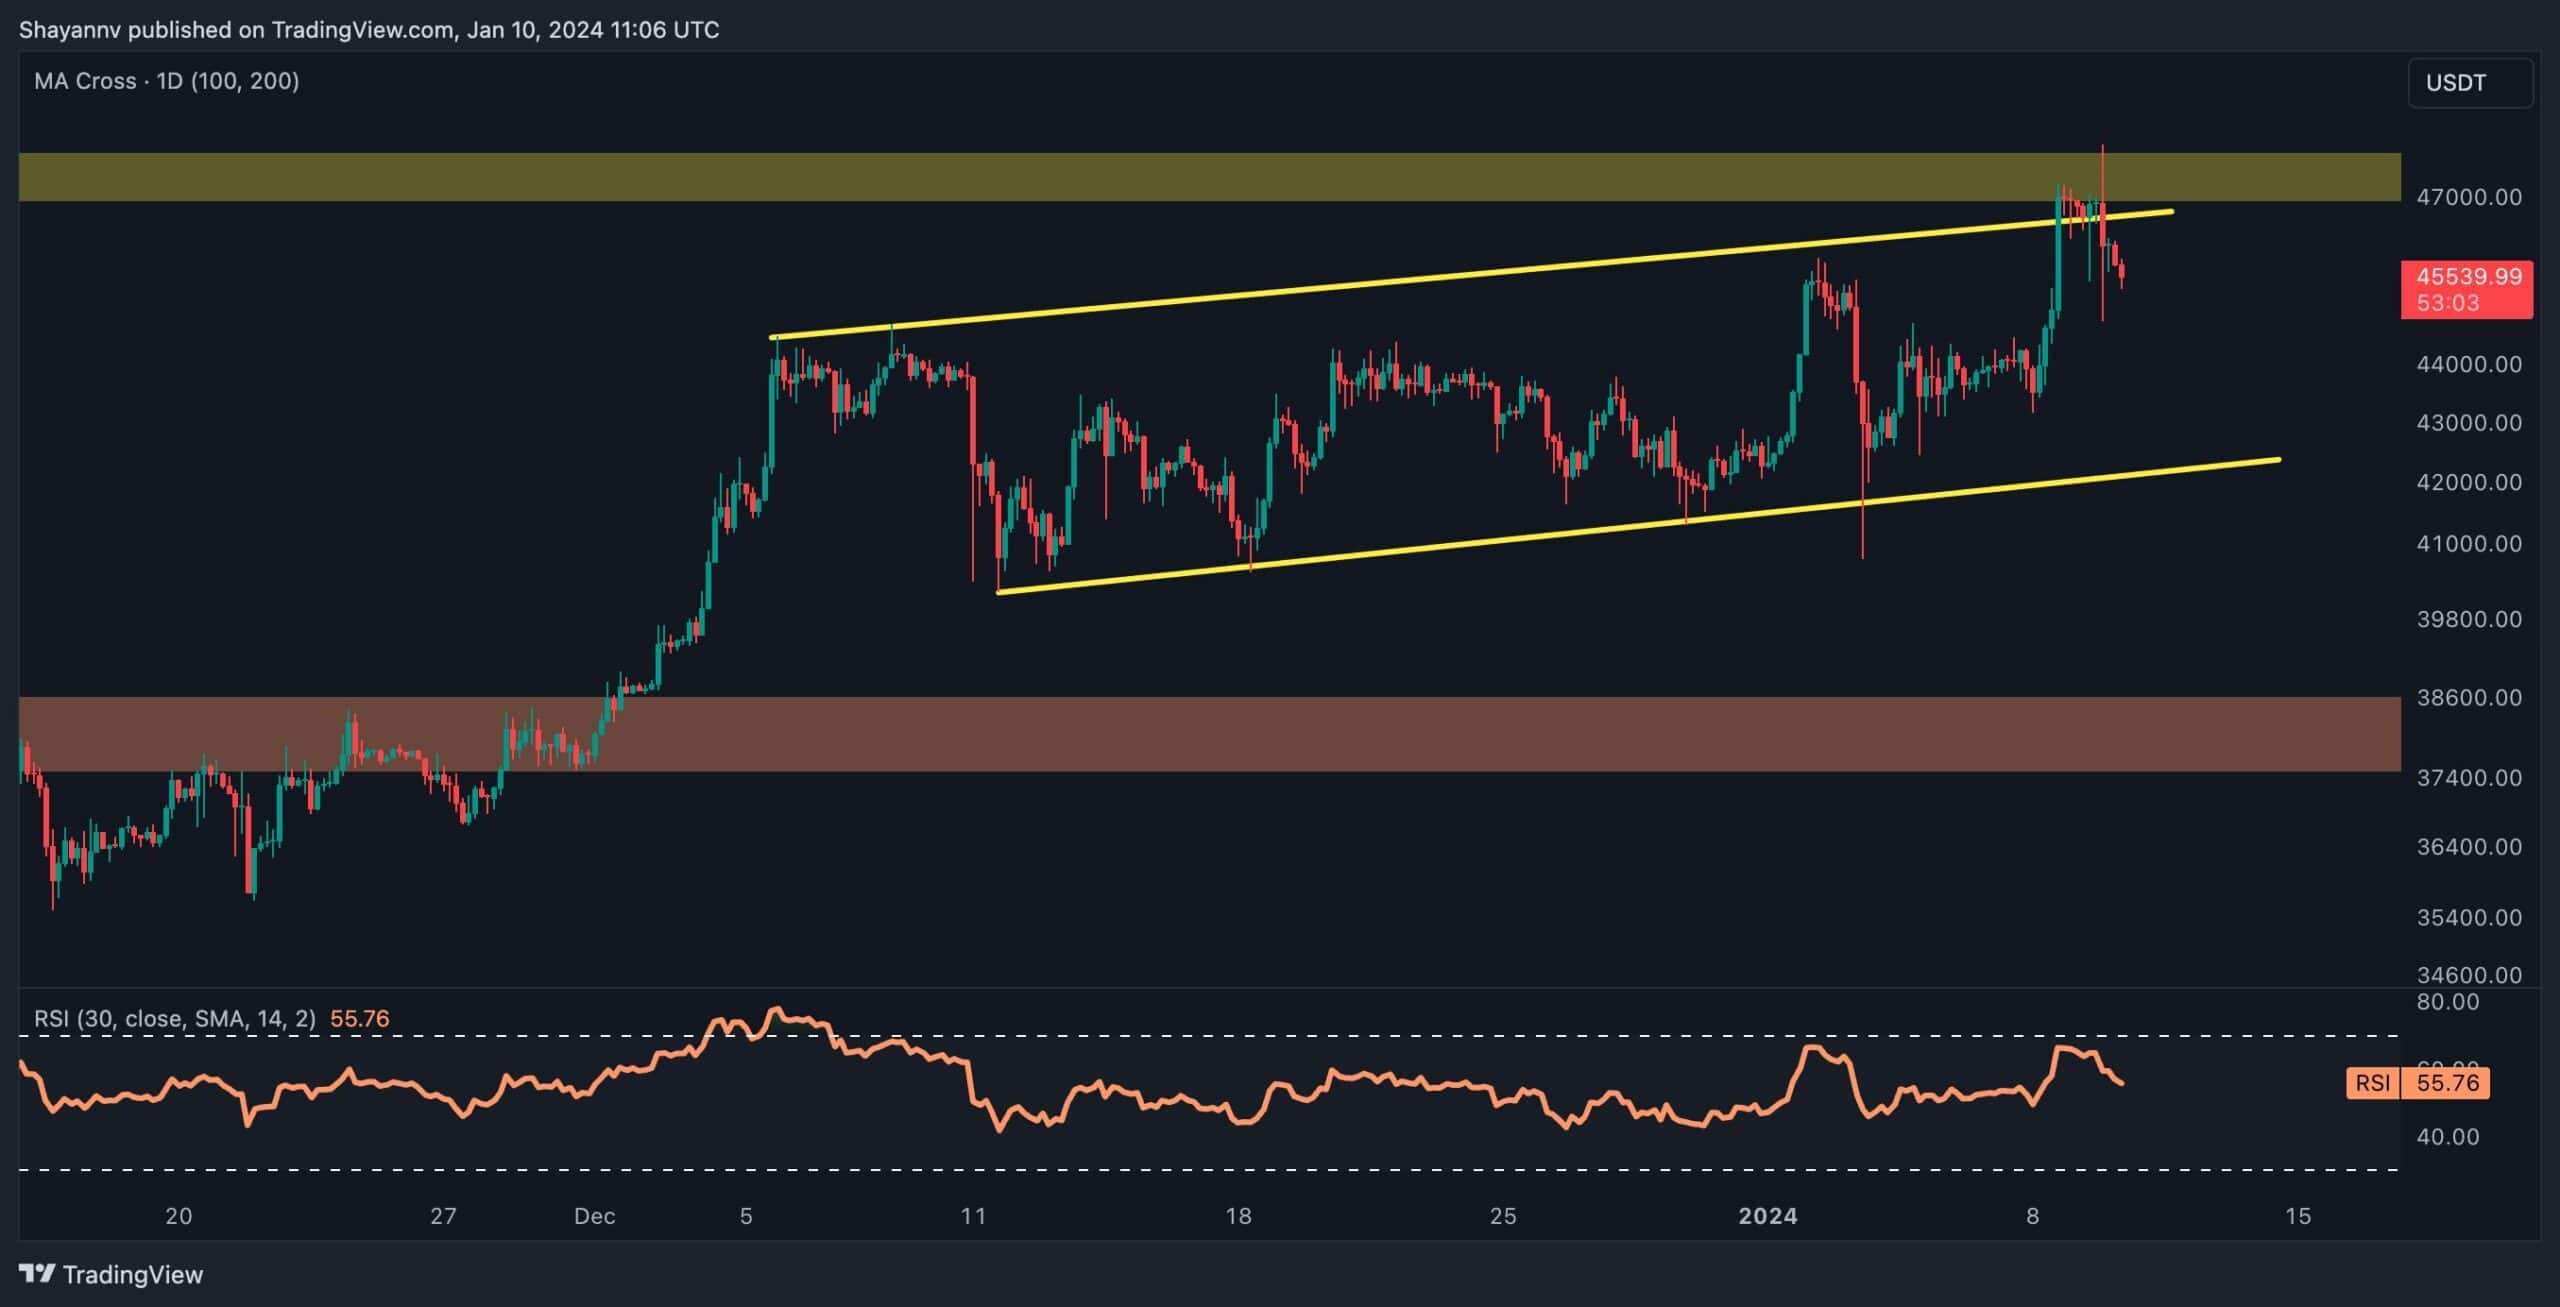
A detailed analysis of the 4-hour chart shows Bitcoin’s price engaged in an ascending consolidation, gradually approaching the crucial $48K resistance region. This indicates a balance between buyers and sellers. Within this consolidation, an ascending flag pattern is forming, with the upper threshold aligning with the key resistance at $48K.
Currently, the price is attempting to breach the upper boundary of the flag, leading to heightened volatility as buyers and sellers struggle. A successful breakout could set the stage for a renewed, notable, bullish movement. However, given the current market conditions and sentiment, Bitcoin’s next direction may remain unclear until the SEC ruling on Bitcoin spot ETFs.

On-chain Analysis
By Shayan
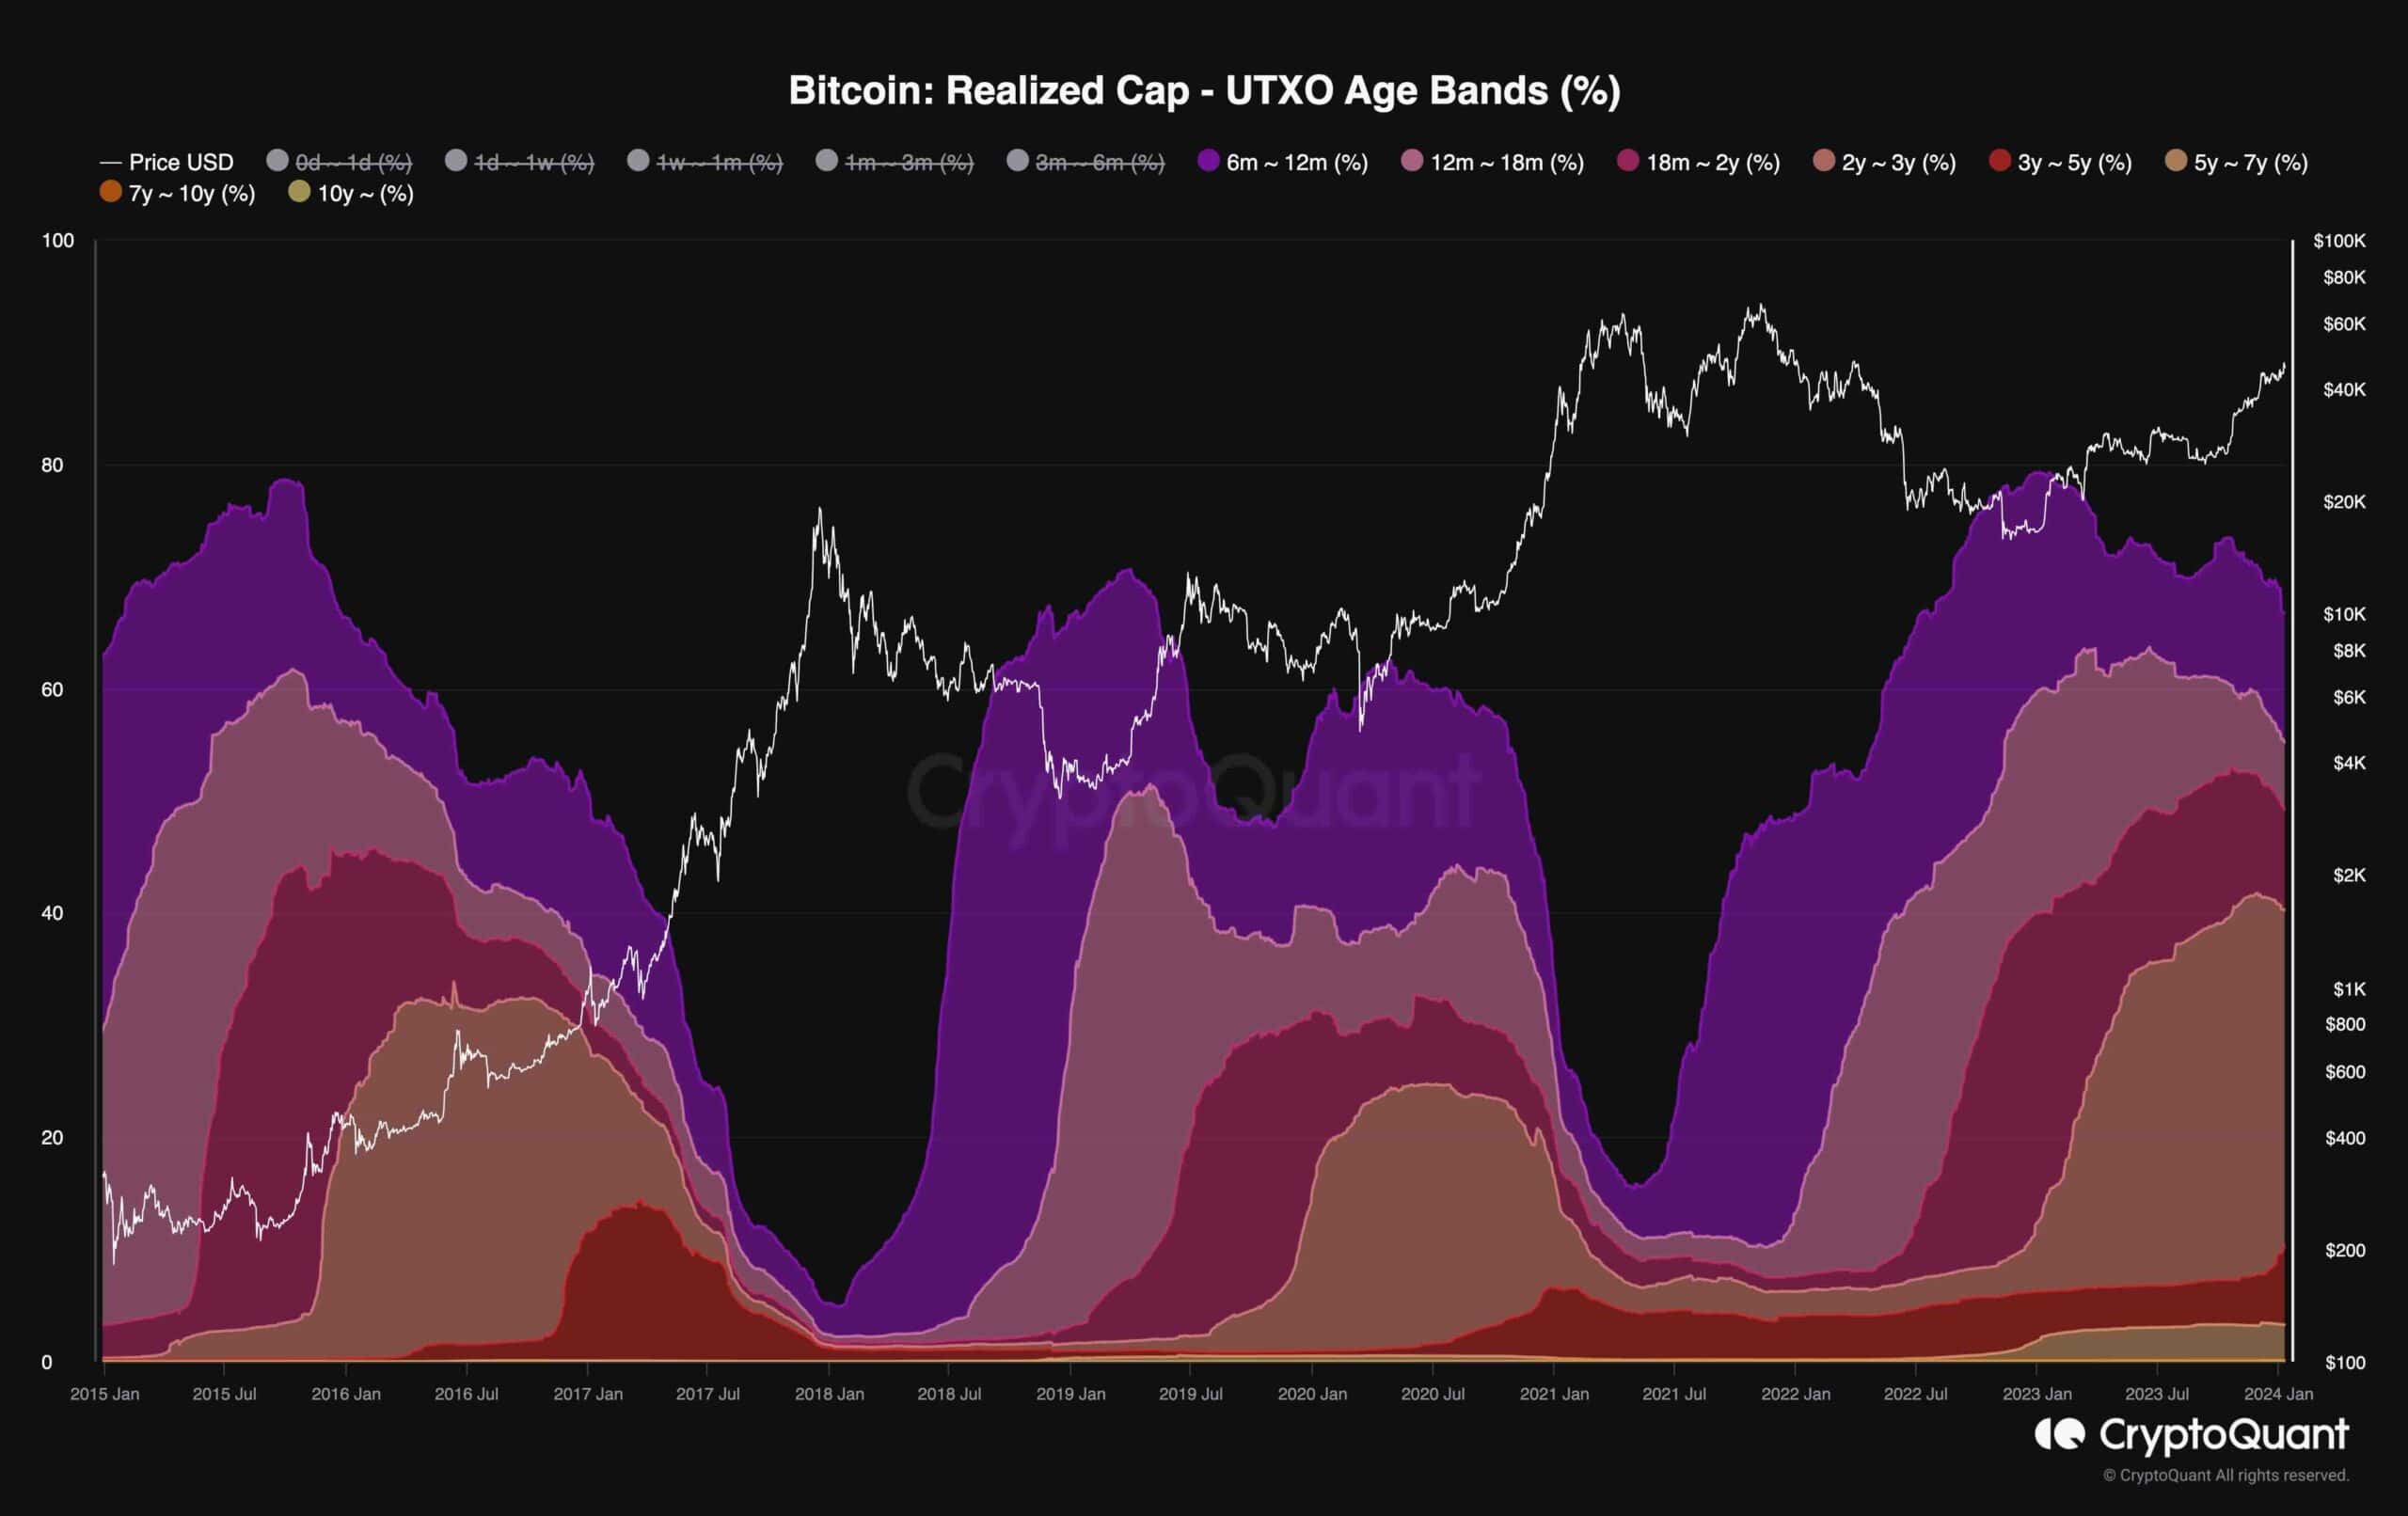
The Realized Cap, measured through UTXO Age Bands, provides insight into the distribution of realized capitalization based on the age of unspent transaction outputs (UTXOs). Each colored band represents the proportion of Realized Cap held by UTXOs last moved within a specified time frame.
Realized Cap is determined by valuing each UTXO at the price it had when it last moved, offering a snapshot of capital held by both long-term and short-term holders. In essence, spikes in these age bands indicate periods of HODLing and accumulation among Bitcoin holders, while decreases suggest selling and distribution activities.
UTXOs older than six months, categorized as Long Term Holders (holding BTC for over 155 days), contribute to almost 90% of the realized cap. In previous sell-offs during cycles, such as those on September 15 and April 19, this indicator surpassed 70% before experiencing a decline. Historically, when these values diminished for each group, Bitcoin’s price witnessed significant surges. A similar trend is unfolding, pointing towards a potentially healthy bullish market from a long-term perspective.

Binance Free $100 (Exclusive): Use this link to register and receive $100 free and 10% off fees on Binance Futures first month (terms).
Disclaimer: Information found on CryptoPotato is those of writers quoted. It does not represent the opinions of CryptoPotato on whether to buy, sell, or hold any investments. You are advised to conduct your own research before making any investment decisions. Use provided information at your own risk. See Disclaimer for more information.
Cryptocurrency charts by TradingView.


