


Bitcoin is facing challenges in surpassing the significant resistance at $30K, which has been holding the price for a prolonged period. If successful, this breakthrough would result in a bullish bias for the cryptocurrency in the medium term.
By Shayan
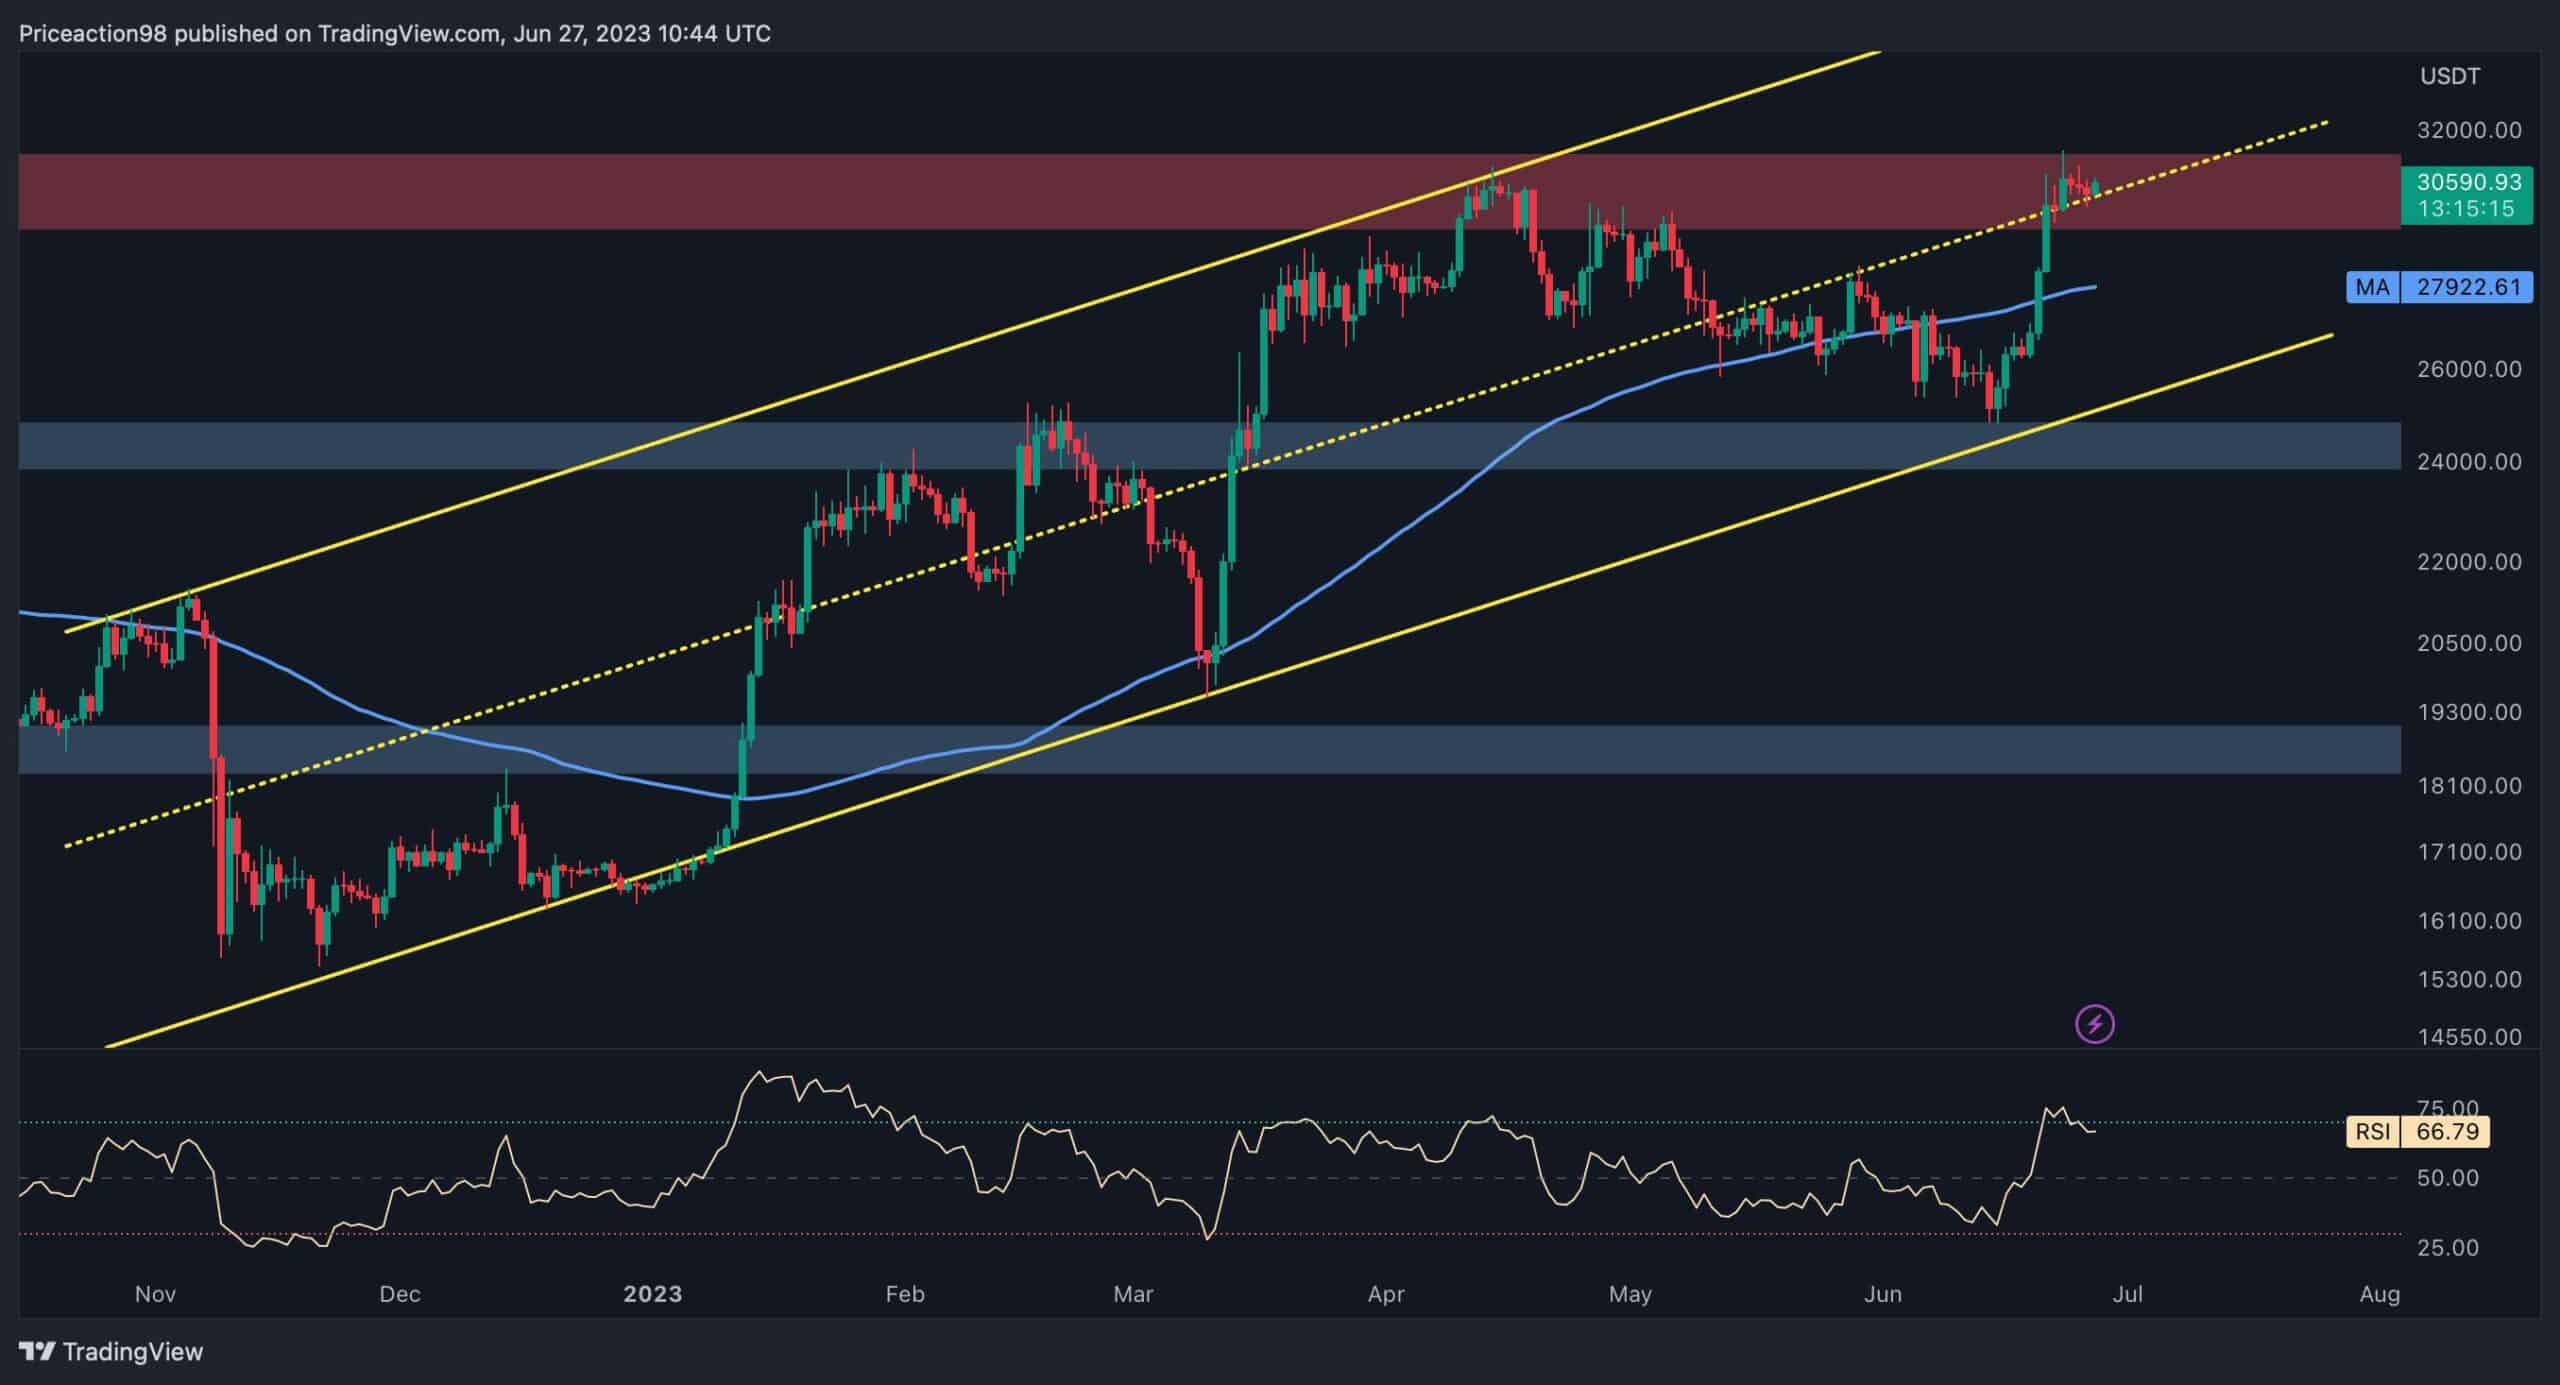
Bitcoin recently found support at both the static support level of $25K and the lower trendline of the channel. Consequently, the substantial buying pressure in this support region led to a significant surge, with the aim of breaking through the $30K resistance.
However, upon reaching the $30K level, Bitcoin entered a consolidation phase, accompanied by weakened bullish momentum.
It is important to note that the price has formed a double-top – a well-known bearish reversal pattern, at this level, thereby increasing the likelihood of a short-term reversal. Furthermore, the RSI indicator currently indicates an overbought condition in the market, acting as a catalyst for the potential reversal scenario.
In the event that the price faces rejection within this crucial price range, the first target for Bitcoin would be the 100-day moving average of $27,900.
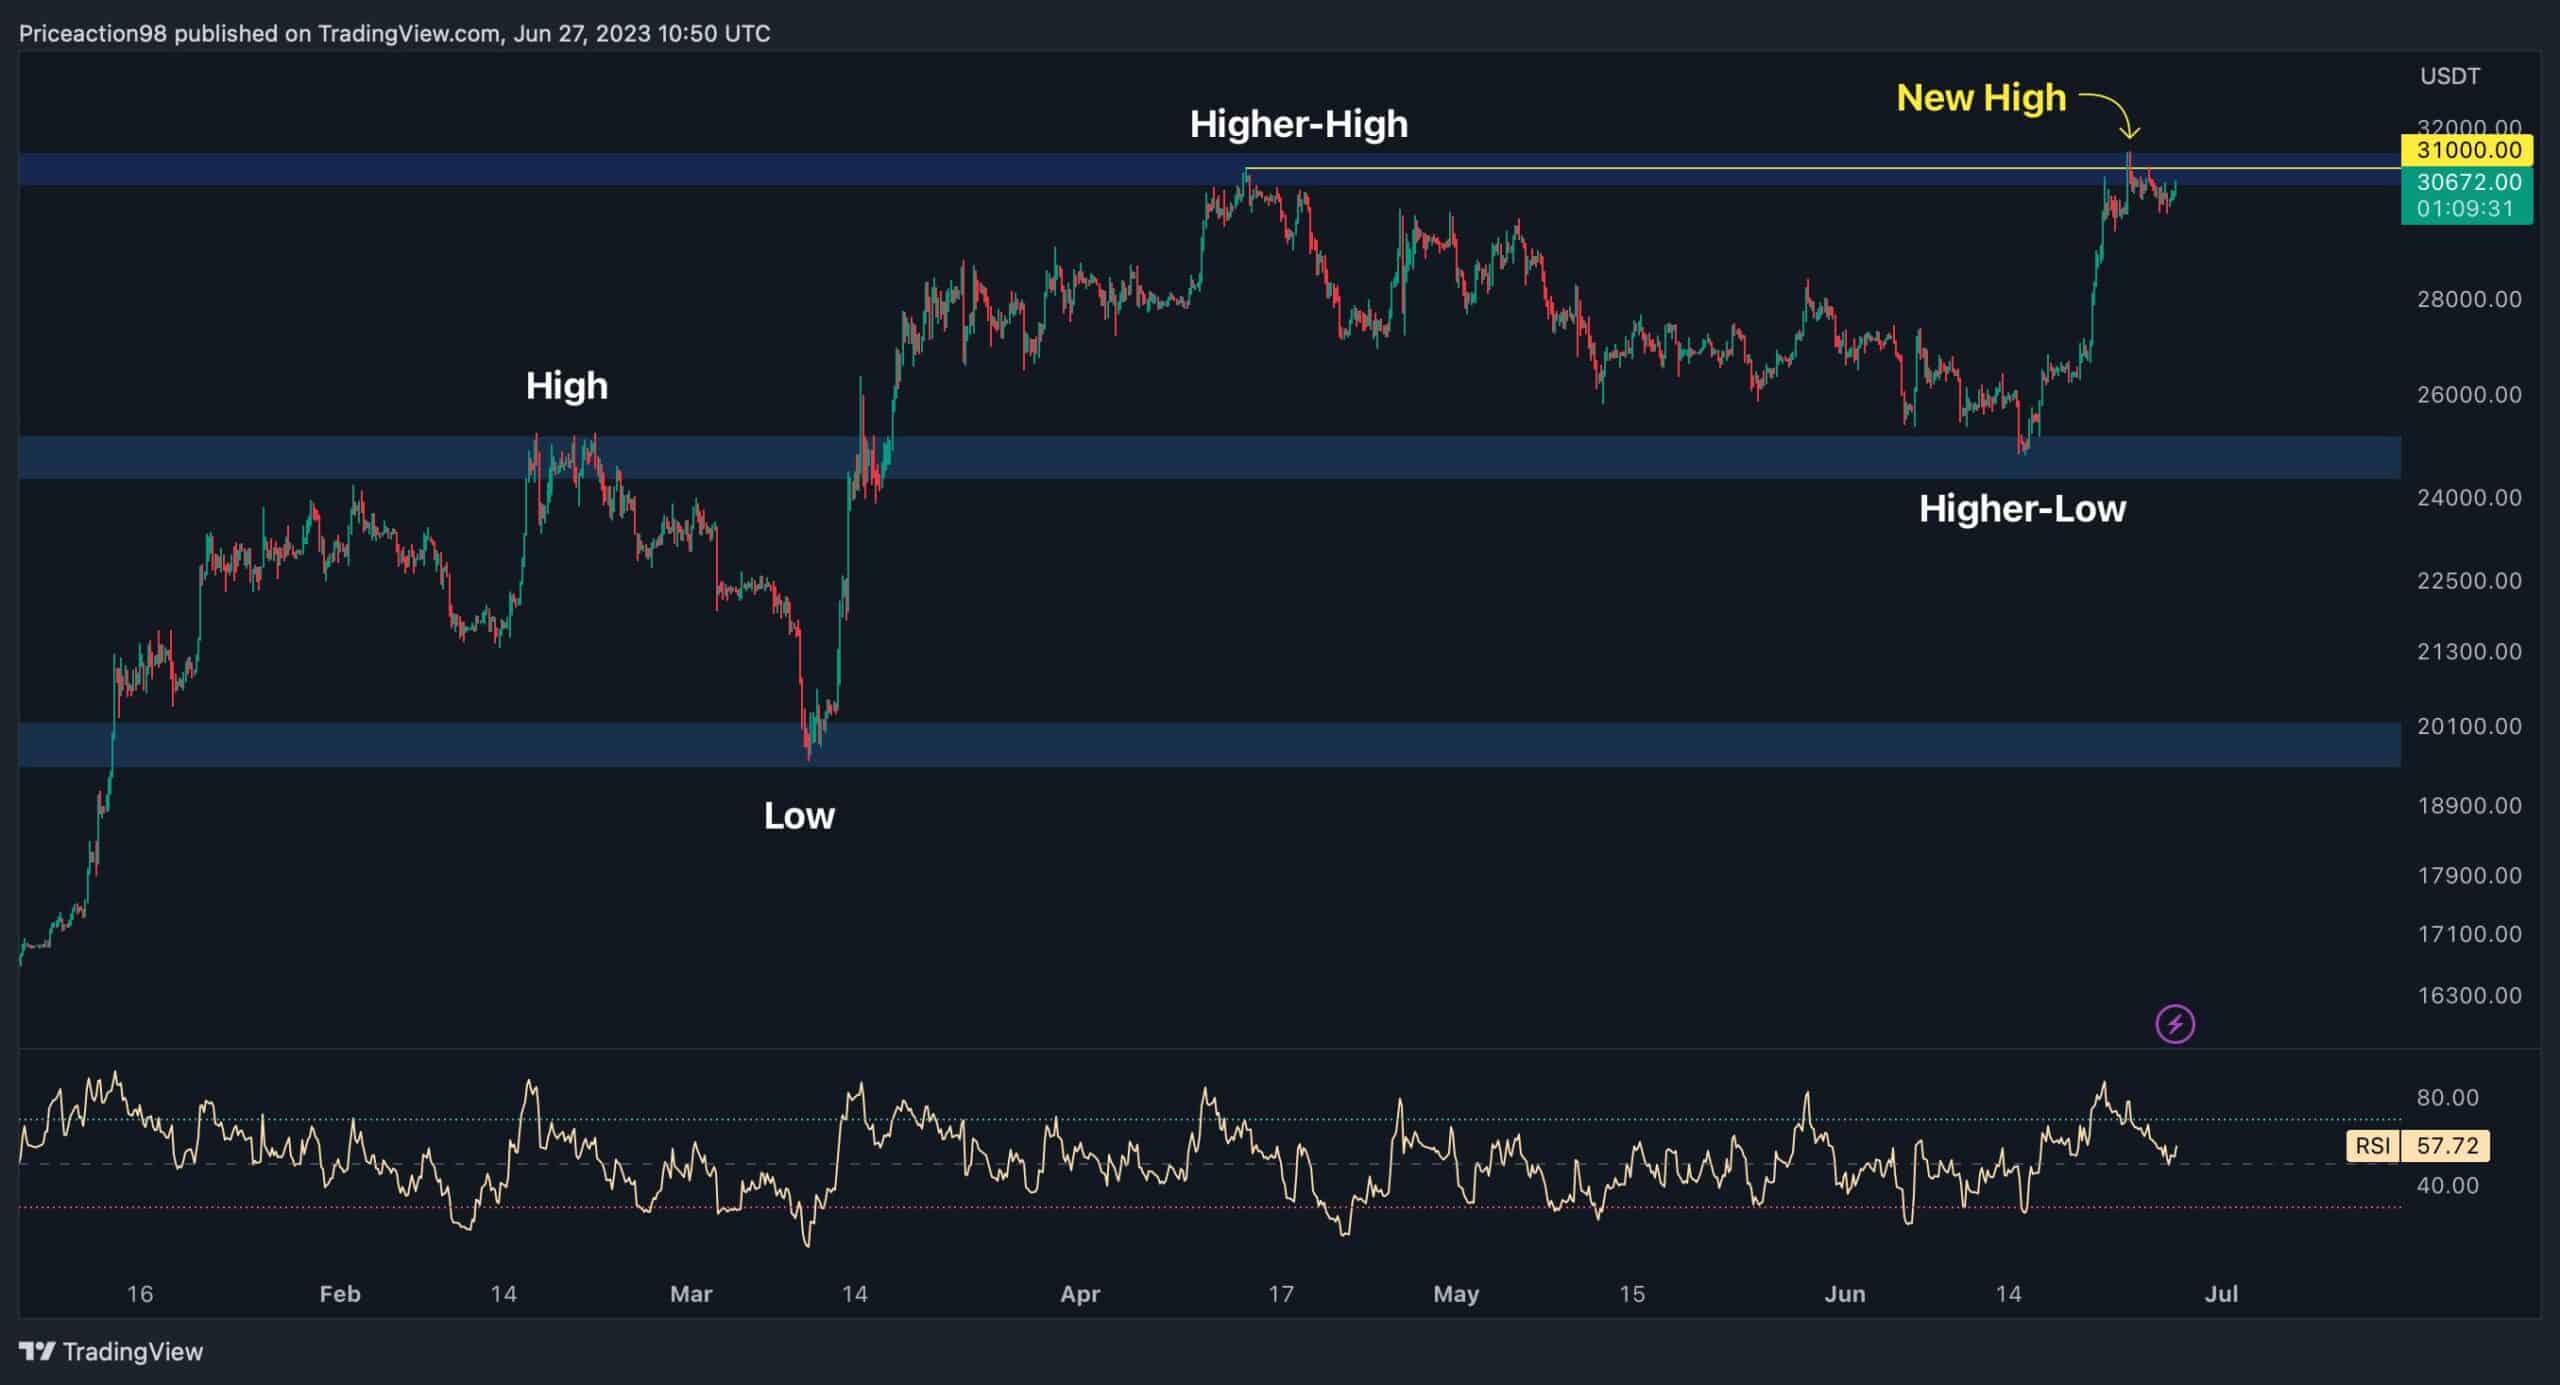
Switching to the 4-hour chart, Bitcoin developed a series of higher highs and higher lows during the recent bullish phase, indicating a healthy and robust upward rally. However, upon encountering the $30K resistance, the rally stopped, and the price entered a consolidation phase without providing any clear indication of its next move.
Most recently, the price slightly surpassed the previous major high at $31K, creating a new high. Nonetheless, since the cryptocurrency hasn’t continued its upward movement beyond the $31K mark, this cannot be considered a new significant high.
Ultimately, if Bitcoin breaks above the $30K region and consolidates at higher levels, it will likely trigger a solid bullish rally. Conversely, if selling pressure dominates the market and leads to a decline, the following targets for Bitcoin would be the 100-day moving average at $29K and the static support level of $25K.
By Shayan
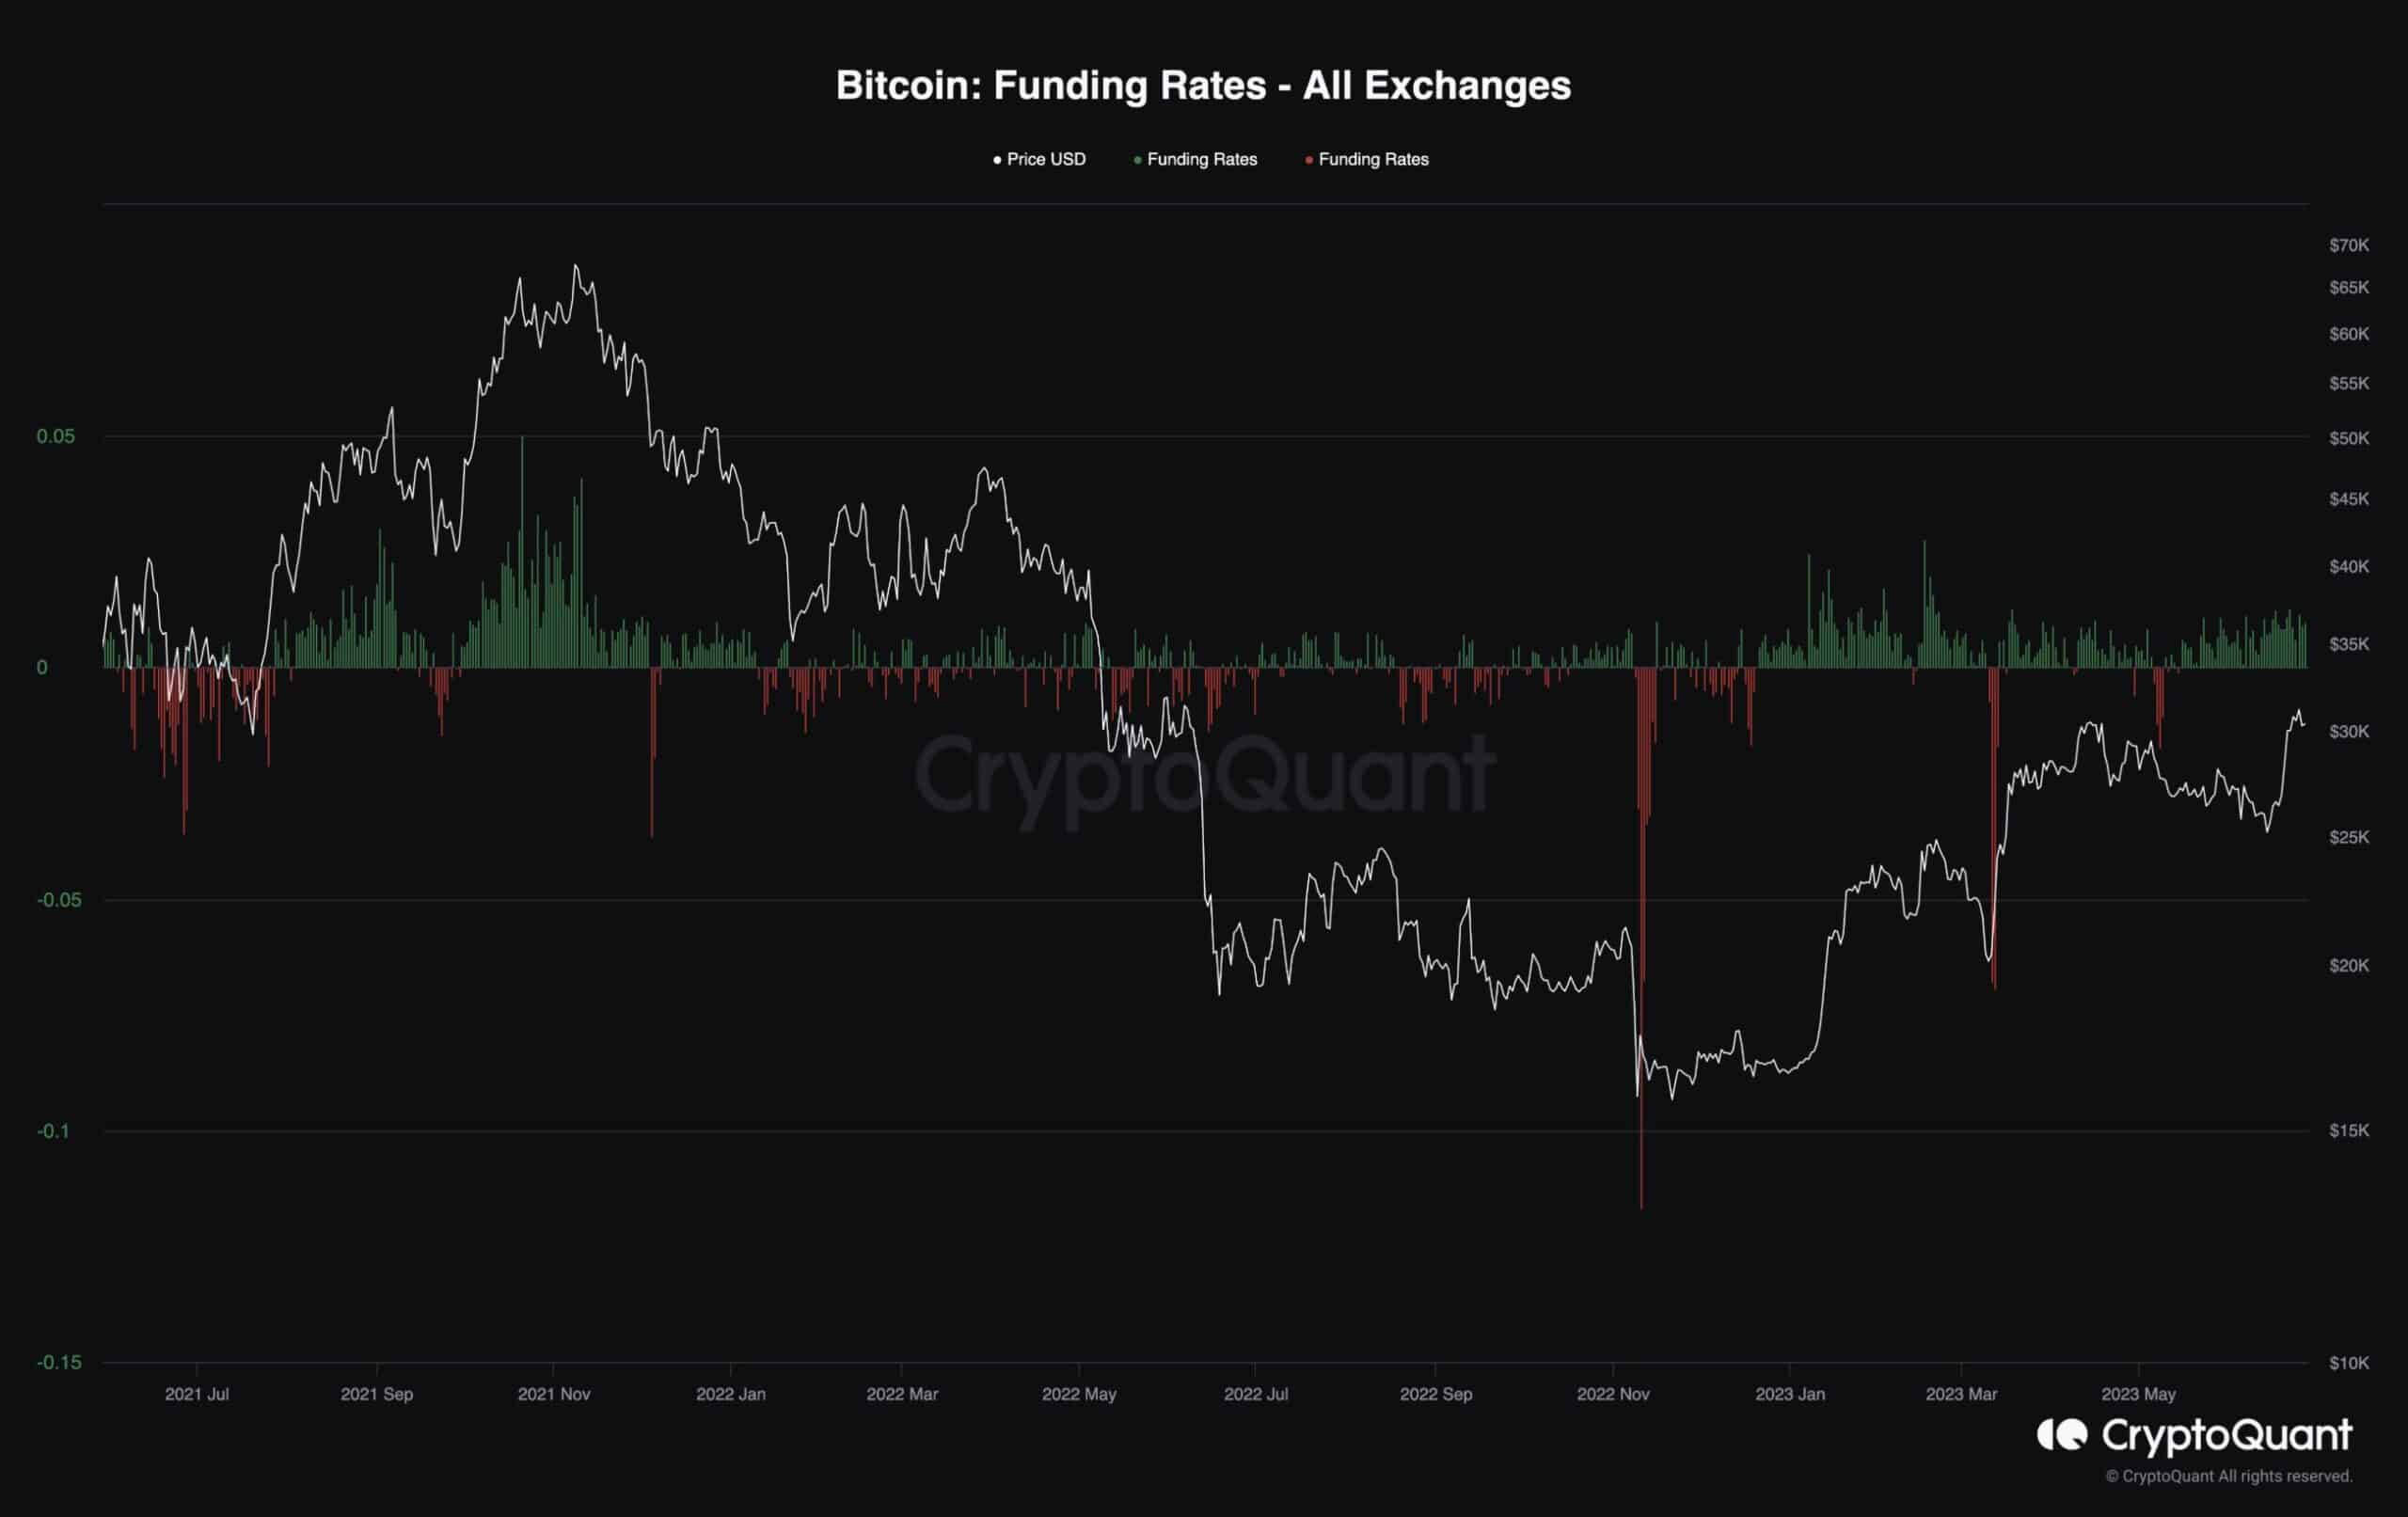
Bitcoin Funding Rates
There is no denying how much Bitcoin’s price action is influenced by the futures market, especially during the recent cycle. Therefore, analyzing its sentiment could provide some useful insight into how the price is likely to act in the short term.
This chart represents the Bitcoin funding rates metric, indicating whether the long traders or the short sellers dominate at any given time.
It is evident that following the recent surge in price, the funding rates have been demonstrating positive values constantly, pointing to the fact that the futures market is partly responsible for the recent rally and that the derivatives traders are bullish on BTC.
Yet, positive funding rates also increase the probability of a long liquidation cascade happening, which could reverse the current trend in a matter of days. As a result, investors should be wary of a growing chance of a rapid decline in the coming weeks, especially if the funding rates experience more growth.
Binance Free $100 (Exclusive): Use this link to register and receive $100 free and 10% off fees on Binance Futures first month (terms).
PrimeXBT Special Offer: Use this link to register & enter CRYPTOPOTATO50 code to receive up to $7,000 on your deposits.
Disclaimer: Information found on CryptoPotato is those of writers quoted. It does not represent the opinions of CryptoPotato on whether to buy, sell, or hold any investments. You are advised to conduct your own research before making any investment decisions. Use provided information at your own risk. See Disclaimer for more information.
Cryptocurrency charts by TradingView.
 Jumps by 7% Daily, Bitcoin (BTC) Eyes $85K Again (Market Watch)")

")
 Jumps by 7% Daily, Bitcoin (BTC) Eyes $85K Again (Market Watch)")
")

