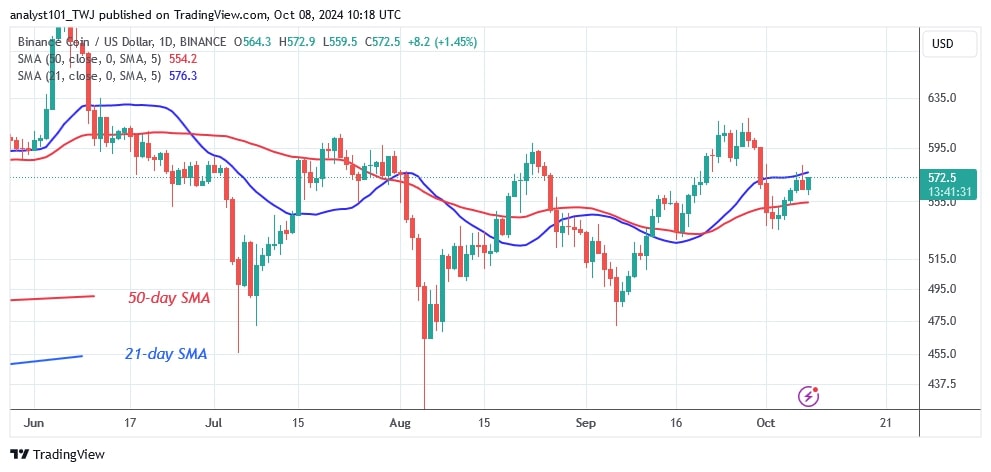
The price of BNB (BNB) has corrected higher after breaking above the moving average lines but was halted by the 21-day SMA.
For the past three days, BNB has been trapped between the moving average lines but remained stable above the $550 support, as reported by Coinidol.com.
BNB long time price prediction: bullish
Depending on whether the moving average lines are broken, the price movement will now be upwards or downwards. If the bulls break through the 21-day SMA resistance line, BNB will rise to the next barrier at $600.
If the price falls below the 50-day SMA support, the altcoin will lose value. BNB will fall and return to its previous lows above $540 and $500. It is currently valued at $574.
BNB price indicators reading
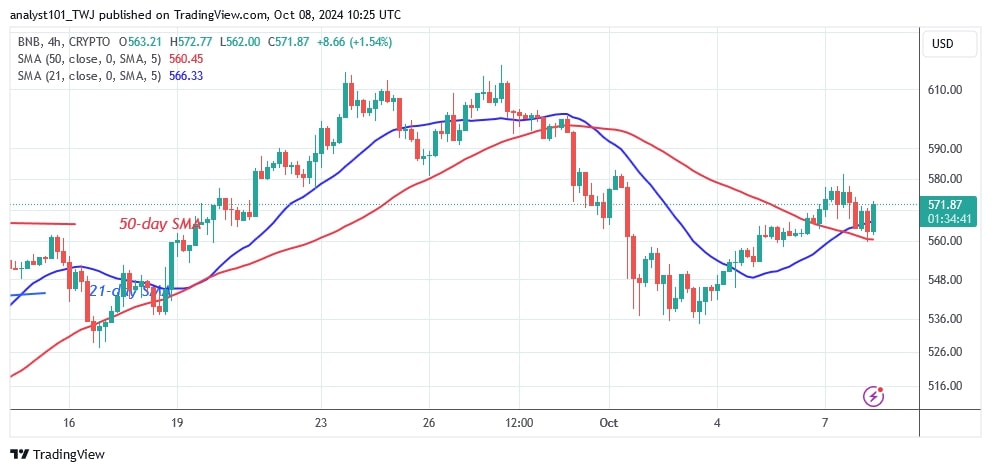
BNB is trading between the moving average lines after a recent upward correction. Over the next few days, the cryptocurrency is likely to stay within its range. On the 4-hour chart, the price of the altcoin is rising while remaining above the moving average lines. The uptrend was stopped at the $580 mark.
Technical indicators:
Resistance Levels – $600, $650, $700
Support Levels – $400, $350
What Is the Next Direction for BNB/USD?
BNB is currently between the 50-day SMA support and the 21-day SMA resistance. In other words, the altcoin is trading above the $550 support but below the $580 barrier. The sideways trend will start when the price breaks the current constriction.

Disclaimer. This analysis and forecast are the personal opinions of the author. They are not a recommendation to buy or sell cryptocurrency and should not be viewed as an endorsement by CoinIdol.com. Readers should do their research before investing in funds.


