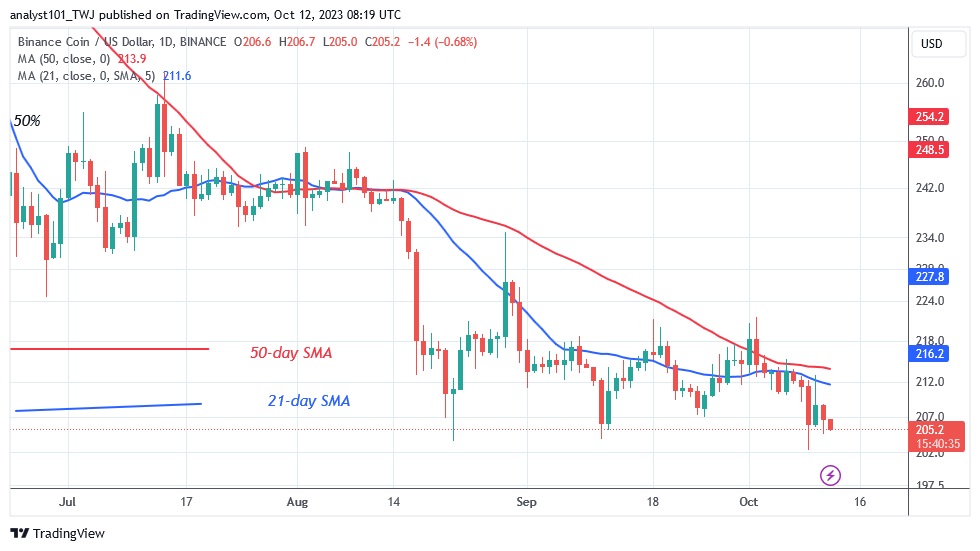
The latest price analysis by Coinidol.com report, the price of Binance Coin (BNB) continues to trade within a limited trading range.
BNB price long term forecast: bearish
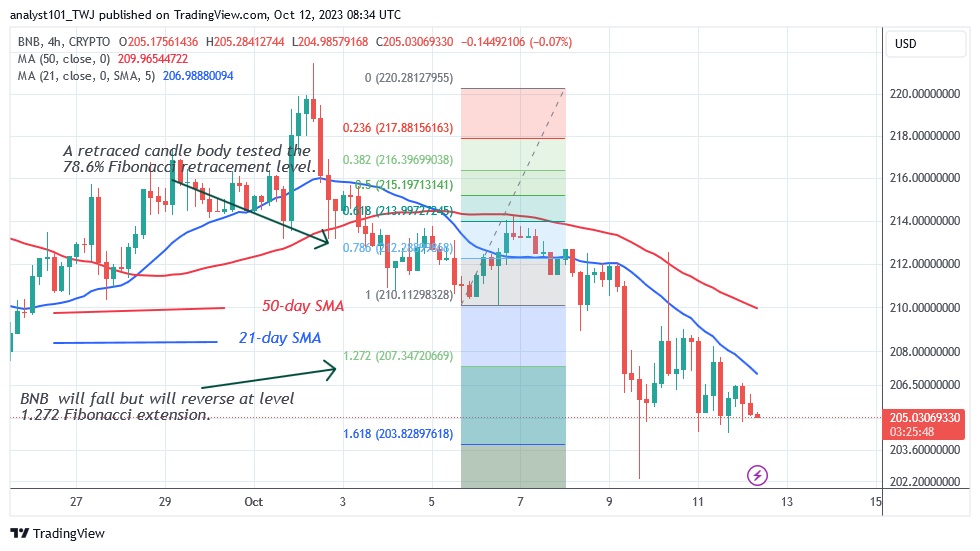
The limited price range is between $200 and $213. In the last 48 hours, there were rapid price fluctuations. BNB retested the October 9 low of $202 before retracing. Bulls bought the dips as the price rose to the $213 resistance level. BNB is currently moving back just a bit between the moving average lines. Buyers are protecting the current support at $200 on the downside. The extended candle tails also show active buying at lower price levels.
BNB indicator display
BNB price bars have consistently closed below moving average lines. BNB prices have remained steady as selling pressure has reached bearish exhaustion. Moreover, the market is oversold as the probability of selling pressure is low. The 50-day line SMA and the 21-day line SMA serve as price bar resistance lines.

Technical indicators:
Key resistance levels – $300, $350, $400
Key support levels – $200, $150, $100
What is the next direction for BNB/USD?
The Binance coin at the bottom of the chart has remained within its range. The price range has not changed as doji candlesticks are present. The altcoin’s range will remain unchanged. However, if buyers are attracted by cheaper prices, the price may increase. This will drive the price of the altcoin up.

As we reported on October 6, Binance coin recovered and crossed the moving average lines on September 28. The high of $221.60 marked the end of the uptrend.
Disclaimer. This analysis and forecast are the personal opinions of the author and are not a recommendation to buy or sell cryptocurrency and should not be viewed as an endorsement by CoinIdol.com. Readers should do their research before investing in funds.


