Binance coin (BNB) price slide has slowed down as bulls hold above the $470 support level. The altcoin has been trading below the moving average lines but above the $470 support over the past week.
Long-term outlook for the BNB price: bearish
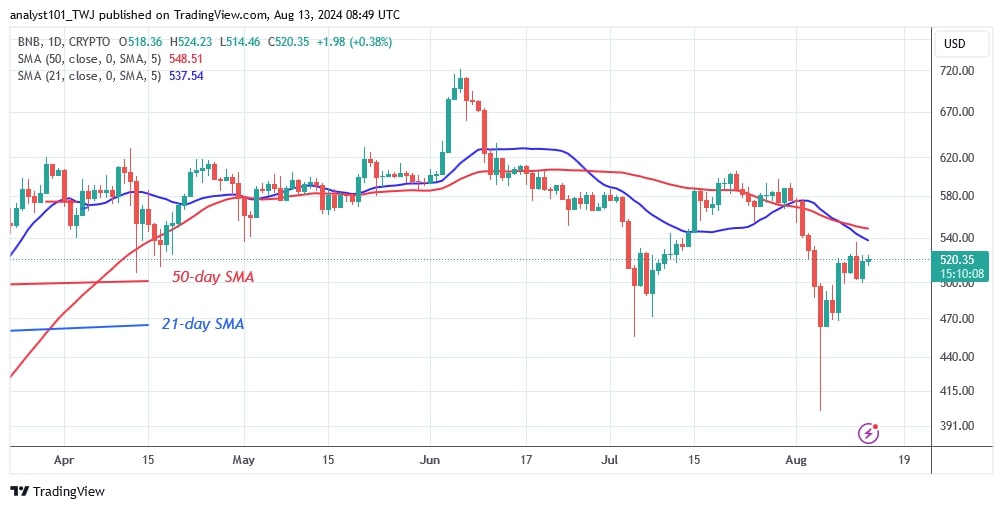
On August 11, buyers were rejected as they tried to hold the price above the 21-day SMA. Today, BNB is correcting higher and meeting resistance at the moving average lines. BNB will return to its previous high of $620 if the buyers hold the price above the moving average line. However, the positive scenario is unlikely as BNB is in for another decline.
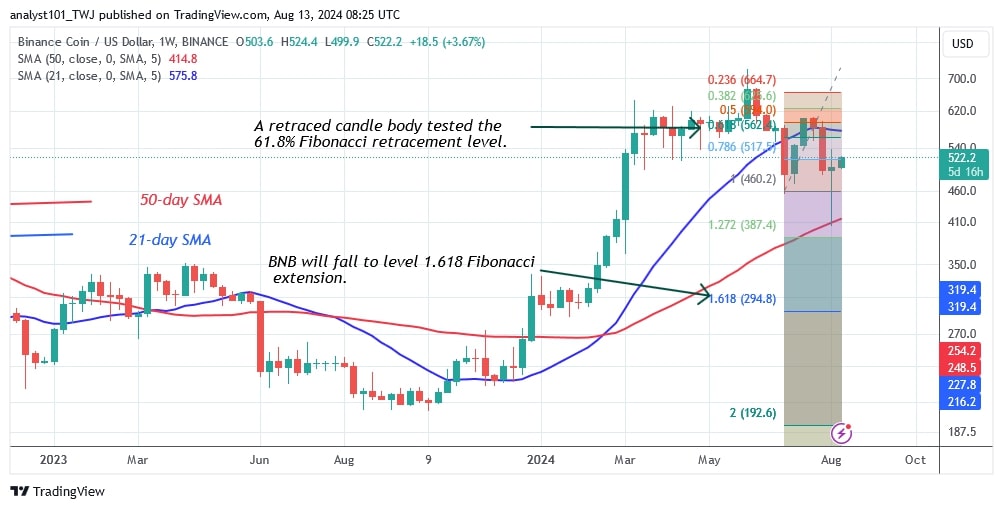
On the downside, the altcoin will fall above the 1.618 Fibonacci extension or the low of $294 if the bears sink below the 50-day SMA or the low of $410.
BNB indicator reading
On the daily chart, the price bars are below the moving average, indicating that the altcoin faced rejection on August 11. However, the altcoin may continue to fluctuate if it is trapped within the moving average lines. The altcoin may fall if the moving average lines on the daily chart show a bearish crossover.
Technical indicators:
Key Resistance Levels – $600, $650, $700
Key Support Levels – $400, $350, $300
What is the next direction for BNB/USD?
The price points to a further decline in the cryptocurrency to the 1.618 Fibonacci extension level or $294. In the meantime, BNB is trading in a range between $470 and below the moving average lines or resistance at $540. The upside correction could face rejection at the recent high.

Coinidol.com reported previously that the price of Binance or BNB coin (BNB) is falling below the moving average lines. However, the decline has stopped above the 50-day SMA on August 5.
Disclaimer. This analysis and forecast are the personal opinions of the author. They are not a recommendation to buy or sell cryptocurrency and should not be viewed as an endorsement by CoinIdol.com. Readers should do their research before investing in funds.


