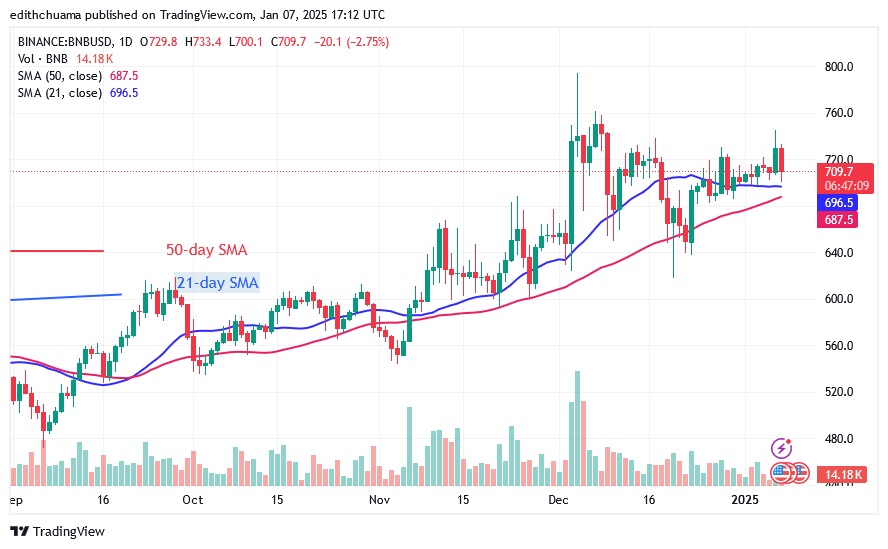
The latest price analysis by Coinidol.com report, the price of Binance Coin (BNB) is holding above the 21-day SMA support and below the $745 resistance level.
BNB price long term forecast: bullish
The cryptocurrency value remained largely steady above the $700 mark but moved back to $688.
Since December 28, 2024, the bulls have defended the 21-day SMA support level. Today, the BNB price has retraced and rallied above the 21-day SMA support. Once the 21-day SMA support is held, the range-bound movement will begin. BNB will return to its previous highs. If the bulls break the $745 and $760 resistance levels, the market will reach its previous high of $794.
However, if the bears break the 21-day SMA support, BNB would fall to a low of $635. BNB is currently trading at $689.
BNB indicator reading
The BNB price will rise because the price bars are above the moving average lines. The moving average lines are trending upwards, indicating an upward trend. The price movement was dominated by small, indecisive candles, the so-called doji. The moving average lines have become horizontal due to the end of the uptrend.

Technical indicators:
Key resistance levels – $600, $650, $700
Key support levels – $400, $350, $300
What is the next direction for BNB/USD?
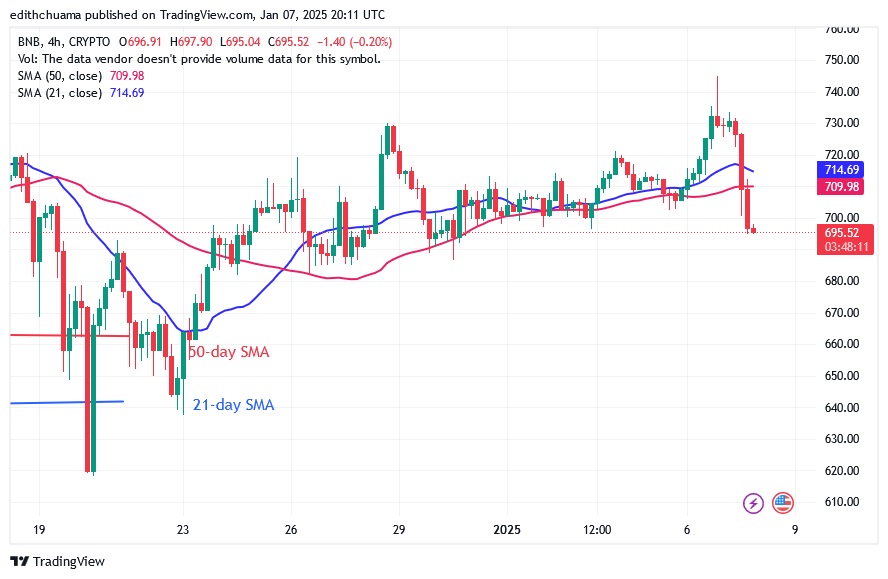
On the 4-hour chart, BNB continues to move sideways above the $700 support and below the $745 resistance. The price of the cryptocurrency tested the current support at $700 and bounced off. The bearish momentum was halted by the 50-day SMA as the altcoin started its uptrend. BNB will continue its movement within a certain range.

Disclaimer. This analysis and forecast are the personal opinions of the author, are not a recommendation to buy or sell cryptocurrency, and should not be viewed as an endorsement by CoinIdol.com. Readers should do their research before investing in funds.


