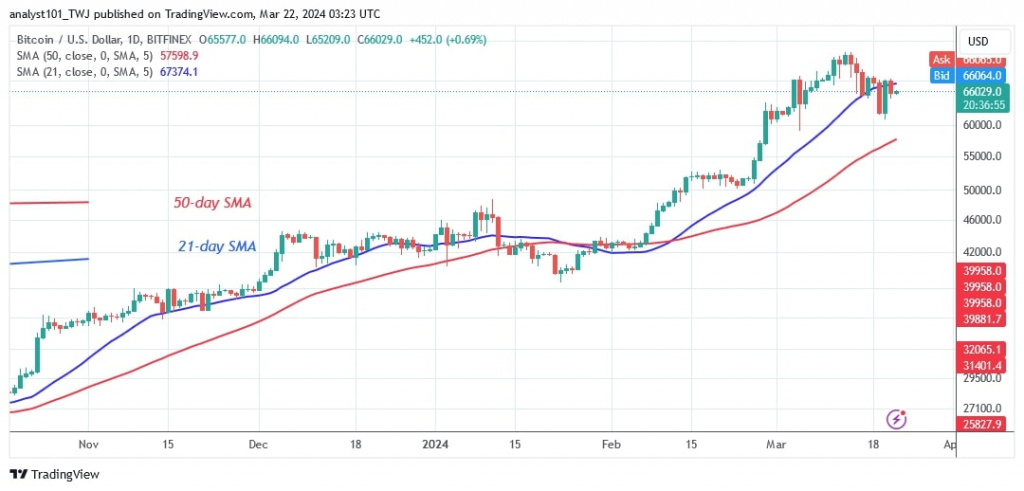
Bitcoin’s (BTC) price is still trapped between moving average lines.
Long-term forecast for the Bitcoin price: bearish
According to price analysis by Coinidol.com the largest cryptocurrency is trading below the 21-day SMA but above the 50-day SMA. The bears fueled the slide even further when buyers failed to keep the price above the 21-day simple moving average.
Meanwhile, bulls and bears continue to battle for control of the price. The bears will have an advantage if the BTC price falls below the 21-day SMA. Bitcoin is currently worth $66,131 after falling below the 21-day SMA support.
If buyers reclaim the 21-day SMA support, Bitcoin price will rally and regain its high of $74,000. On the other hand, if selling pressure picks up again, the negative momentum will continue to the $57,700 level, the low above the 50-day SMA. The current value of Bitcoin is $66,131 (as of this writing).
Bitcoin indicator reading
The largest cryptocurrency is trapped between the moving average lines.
The bulls have been trying hard to lift the price above the 21-day SMA in the last 48 hours. The moving average lines are still pointing upwards despite the recent decline.
Technical indicators:
Key resistance levels – $60,000 and $70,000
Key support levels – $50,000 and $40,000
What is the next direction for BTC/USD?
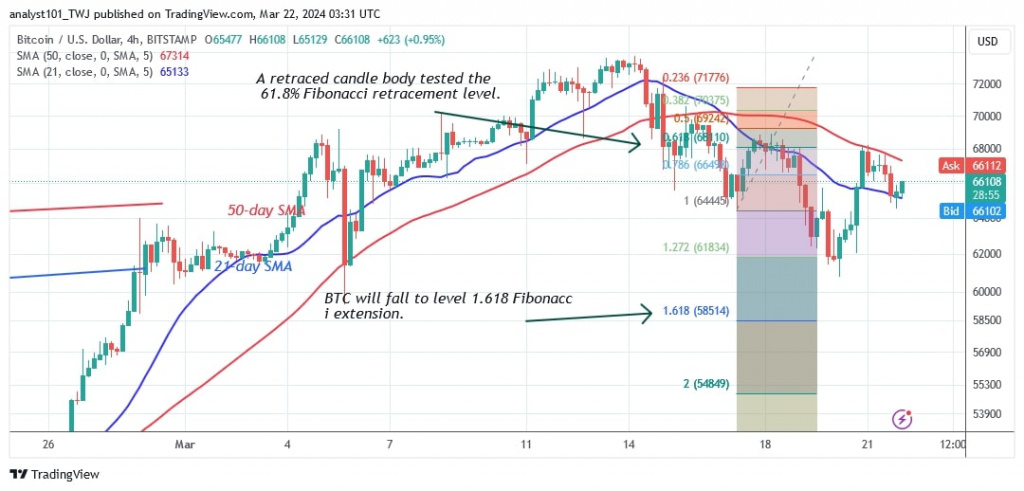
On the 4-hour chart, Bitcoin is in a downtrend but is trapped between the moving average lines. The upward movement has been halted by the 50-day SMA as Bitcoin has retraced between the moving average lines. The cryptocurrency will perform once the moving average lines are broken.
Disclaimer. This analysis and forecast are the personal opinions of the author and are not a recommendation to buy or sell cryptocurrency and should not be viewed as an endorsement by CoinIdol.com. Readers should do their research before investing in funds.


