


- Bitcoin price action on the weekly chart shows a strong uptrend that is relatively simple to comprehend.
- On-chain metrics suggest a blow-off top or a potential correction could be on the way.
- Only time will tell if this correction will lead to another higher low or a trend breakdown signal.
Bitcoin (BTC) price has maintained an uptrend since early 2023. Although the bulls fumbled in September, they are back on track. While a further ascent is likely, BTC needs tailwinds, which may or may not come in the form of an ETF approval. On the contrary, the recent rally seems toppy and is likely to trigger a correction.
Also read: IBTC back on DTCC list; SEC charges BlackRock with failing to disclose investment
Bitcoin price in tough spot
Bitcoin (BTC) 2023 price rally is intact thanks to the persistent production of higher highs and higher lows. Although BTC bulls fumbled in September and produced a lower high on the weekly chart, this was followed by a massive spike in bullish momentum that produced another higher high this week.
While the technicals seem bullish, investors need to exercise caution since the rally was caused by BlackRock’s spot ETF ticker listing on the DTCC website. Further reports showed that this was present on the website since August, which weakens the meaning behind the recent rally and could prompt weak hands to book profits.
Regardless of the market movers, the Relative Strength Index (RSI) is hovering around the overbought level of 70. The last time this happened, in early April, Bitcoin price formed a higher high and was immediately followed by a pullback that produced the subsequent higher low that sustained the 2023 bull rally. Hence, if something similar were to happen, BTC is in the right spot for a correction.
The incoming pullback could send BTC back to $30,000, but in no condition should it breach the last key higher low of $25,836. As long as the Bitcoin price remains above this level, the bull rally is intact.
On the contrary, if Bitcoin price does not pull back but strengthens, either due to improving technicals or ETF approval news, BTC might continue heading higher. In such a case, BTC will retest the $36,294 hurdle first. Overcoming this barrier could lead the big crypto to tag the $40,000 psychological level.
Read more: Bitcoin price shakes, DTCC website crashes after BlackRock iShares BTC Trust delisting
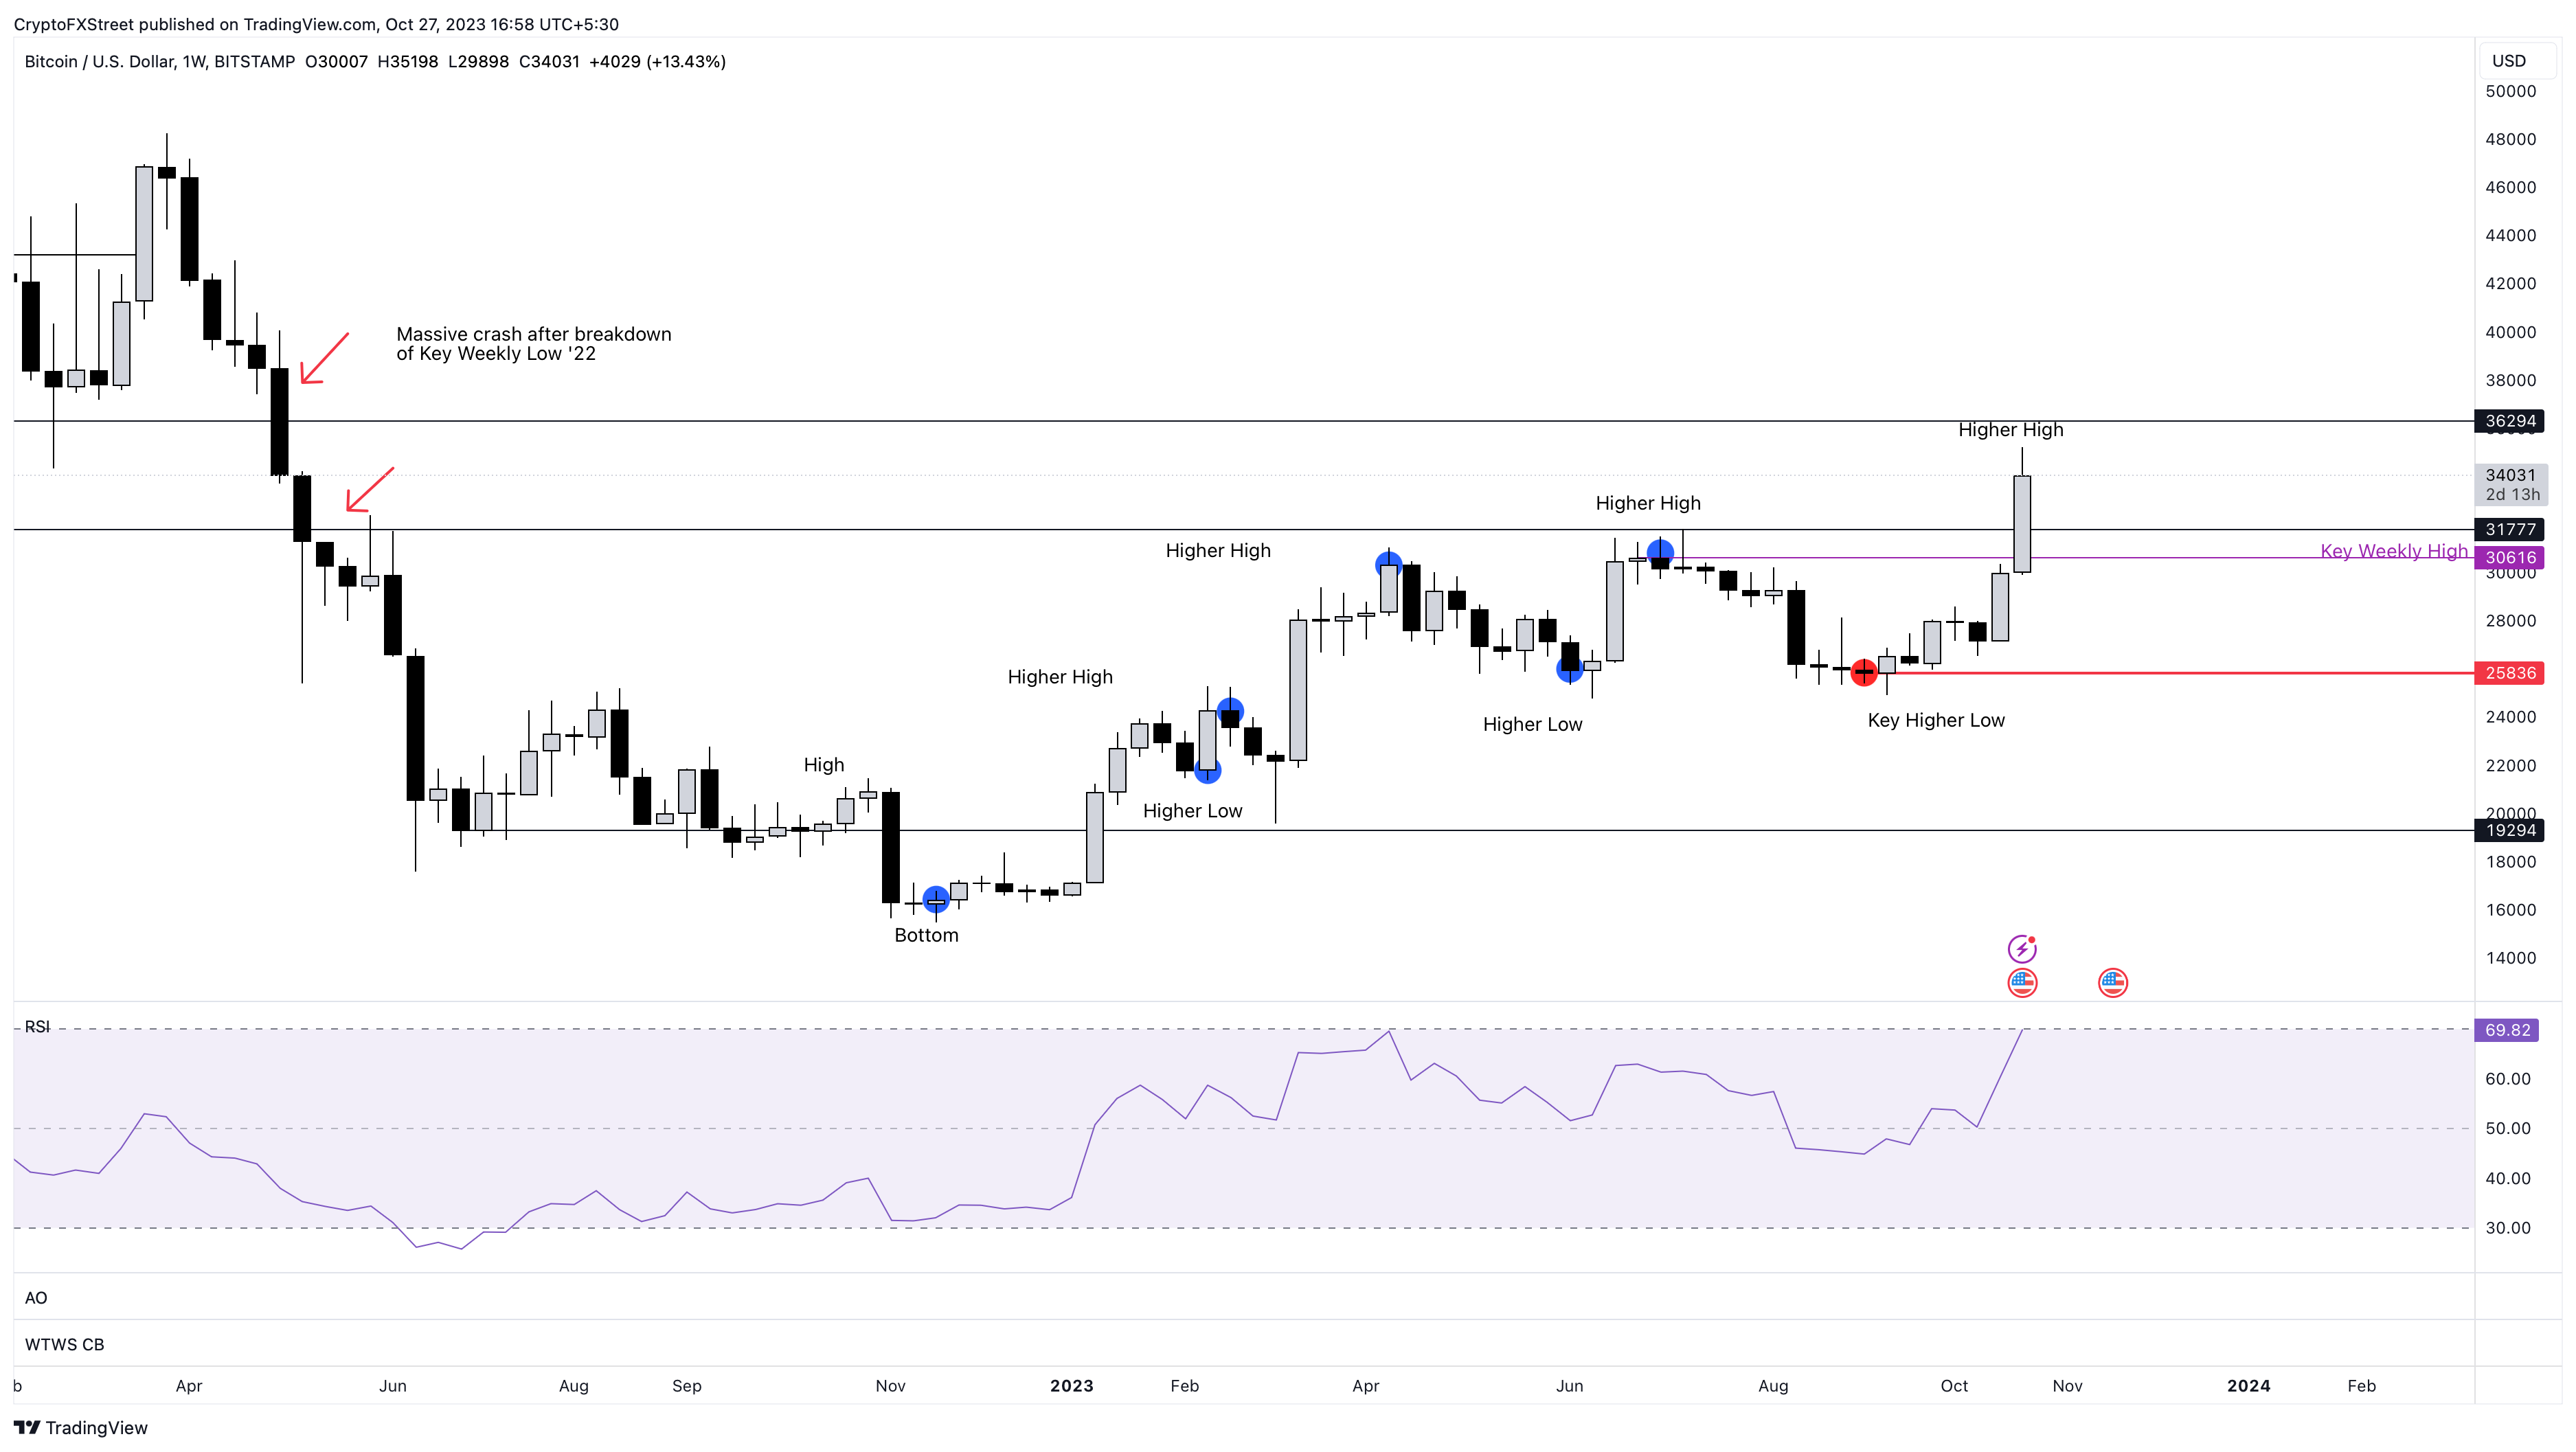
BTC/USDT 1-week chart
The overall outlook of Bitcoin price has been bullish since the start of 2023. Although there were a few moments that had BTC holders guessing the bias, the current scenario is anything but bullish. However, on-chain metrics suggest that investors should be cautious.
On-chain metrics caution BTC holders
The Network Realized Profit/Loss (NPL) index from Santiment shows that the realized profit levels hit a five-month high on October 24. The last time NPL hit the current levels, Bitcoin price was exchanging hands at $30,000. Soon after, BTC formed a local top and triggered a correction.
As discussed above, this index suggests a possibility of an upcoming downward correction for Bitcoin price.
%20%5B15.04.02,%2027%20Oct,%202023%5D-638340089530507590.png)
BTC NPL
Further adding concrete proof for a Bitcoin price correction scenario is the Santiment’s 30-day Market Value to Realized Value (MVRV) indicator. This metric is used to measure the average profit and loss of investors who purchased BTC in the past month. Currently, this index has dropped from nearly 15% to 13%. This number is the percentage of BTC holders over the past month that are in profit. If these investors realized their profits by selling BTC, it would trigger a correction.
Since 2021, the 14%-mark for the MVRV has been a clear local top formation and has catalyzed pullbacks. Hence, if history repeats itself, a retracement is likely for Bitcoin price.
%20%5B15.05.05,%2027%20Oct,%202023%5D-638340089758866661.png)
BTC 30-day MVRV
Santiment’s whale transaction count metric has also seen a massive spike on October 24, which pushed the index to nearly 15,000. The last three times this indicator has seen an uptick, Bitcoin price has undergone a correction.
Hence, if the past repeats, investors should be prepared for a downside move for Bitcoin price.
%20%5B15.06.15,%2027%20Oct,%202023%5D-638340089985917443.png)
BTC whale transaction count
With on-chain metrics and technicals both hinting at a potential stop of the uptrend and the start of a correction, investors should be prepared. While bulls are still in control, a correction that stays above $25,836 will allow the 2023 rally to extend to $40,000 and higher.
But a breakdown of the $25,836 support level on the weekly time frame will produce a lower low. This move will cause massive unrest and doubt to spread among investors. If Bitcoin price produces a lower low after this move, it will confirm trend reversal and potentially lead to a BTC crash to the next key support level at $21,000.
")

")
")
")
")
