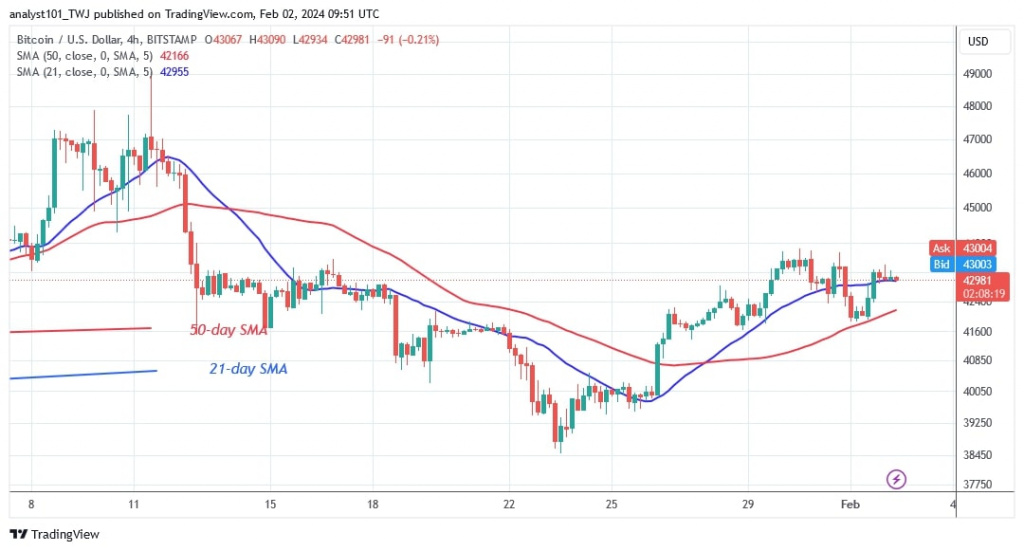
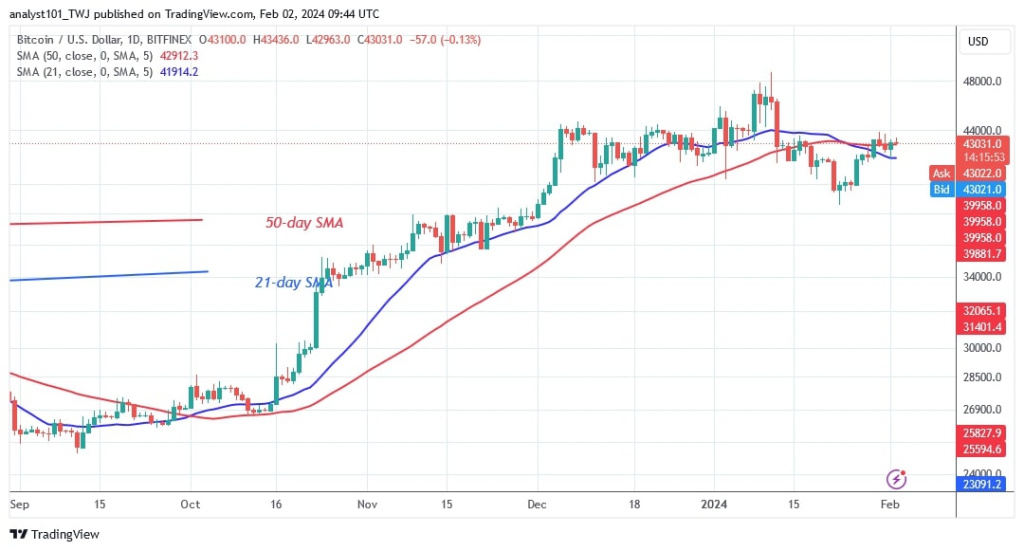
The Bitcoin (BTC) price is currently trading within the moving average lines, despite the strong resistance at the $44,000 mark.
Long-term forecast for the Bitcoin price: bullish
The latest cryptocurrency analysis by Coinidol.com points out that on January 29, buyers kept the price above the moving average lines, but the cryptocurrency was strongly rejected at the $44,000 resistance. The BTC price is now fluctuating between the 50-day SMA and the moving average lines.
Bitcoin is currently trading at $42,961. If Bitcoin rises above the 50-day SMA support, it is expected to rally above the $44,000 resistance. The bullish momentum will continue to a high of $47,000. If the 21-day SMA support is broken, the value of Bitcoin will fall. Bitcoin price will fall to the psychological price level of $40,000.
Bitcoin indicator reading
The BTC price has fallen betweenthe moving average lines after the recent rejection at $44,000. Bitcoin is moving modestly due to the emergence of doji candlesticks. The moving average lines are sloping horizontally due to the termination of the uptrend.
Technical indicators:
Key resistance levels – $35,000 and $40,000
Key support levels – $30,000 and $25,000
What is the next direction for BTC/USD?
After a sharp rejection of the high at $44,000, Bitcoin is currently trading between $41,800 and $44,000. The price movement is limited to the current range. The cryptocurrency is trading modestly due to doji candles. The candlesticks indicate the sentiment of buyers and sellers towards the price.

Disclaimer. This analysis and forecast are the personal opinions of the author and are not a recommendation to buy or sell cryptocurrency and should not be viewed as an endorsement by CoinIdol.com. Readers should do their research before investing in funds.


