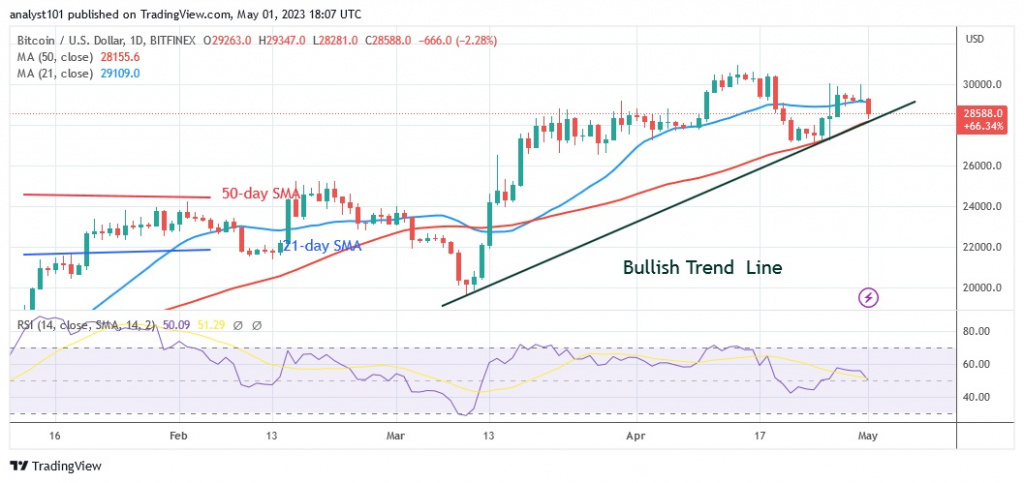
Bitcoin (BTC) price fell after three failed attempts to cross the psychological price barrier of $30,000.
Bitcoin price long-term forecast: bearish
The cryptocurrency’s value fell below the 21-day line SMA, but remained above the 50-day moving average line. At the time of publication, one bitcoin cost $28,555. Selling pressure has eased as the BTC price fluctuates above the $28,500 support and between the moving average lines. The largest cryptocurrency will be forced to move in a range if the moving average lines are not broken. However, the BTC price will continue to fall if the bears break below the 50-day line SMA. The bearish momentum will eventually hit the support at $27,500. If the price bounces back and crosses the 21-day line SMA, Bitcoin will continue to rise in an uptrend. The cryptocurrency will once again reach its previous high of $30,000.
Bitcoin indicator display
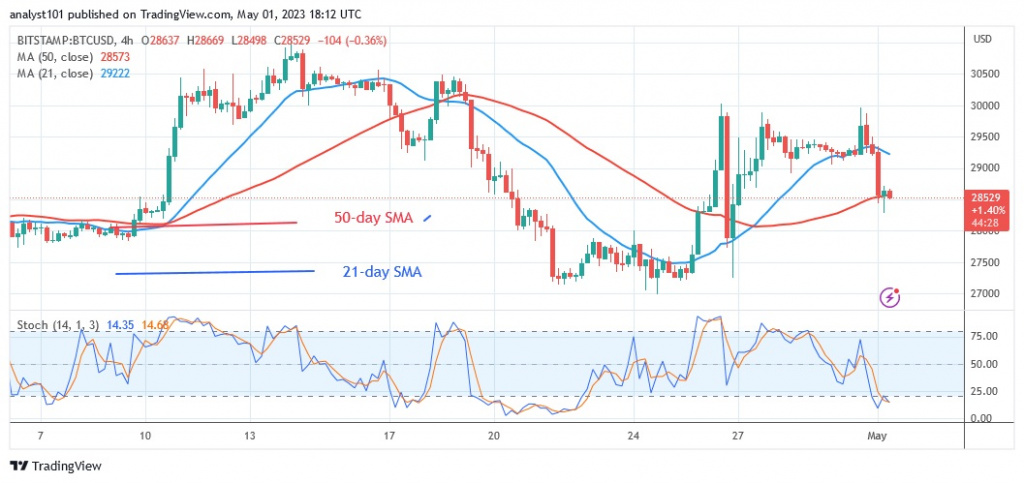
On the Relative Strength Index for period 14, Bitcoin is at level 49. The price of the largest cryptocurrency has reached its neutral point. This indicates that supply and demand are in balance. The price of BTC has fallen between the moving average lines, which indicates that the cryptocurrency might be moving in a certain range. However, if the price falls below the moving average lines, selling pressure will intensify. Bitcoin has since retreated into the oversold area of the market. The daily stochastic value is currently below the level of 20.
Technical indicators:
Key resistance levels – $30,000 and $35,000
Key support levels – $20,000 and $15,000
What is the next direction for BTC/USD?
BTC/USD is supported despite its decline above the low of $28,500. The cryptocurrency price is consolidating above the recent support, indicating that the downtrend has run its course. The bitcoin price is also holding above the 50-day line SMA. The cryptocurrency value will resume its uptrend if the existing support holds.
Disclaimer. This analysis and forecast are the personal opinions of the author and are not a recommendation to buy or sell cryptocurrency and should not be viewed as an endorsement by CoinIdol. Readers should do their research before investing in funds.


