Bitcoin (BTC) has stabilized above the psychological $50,000 mark. Bitcoin price analysis by Coinidol.com.
Long-term forecast for the Bitcoin price: bullish
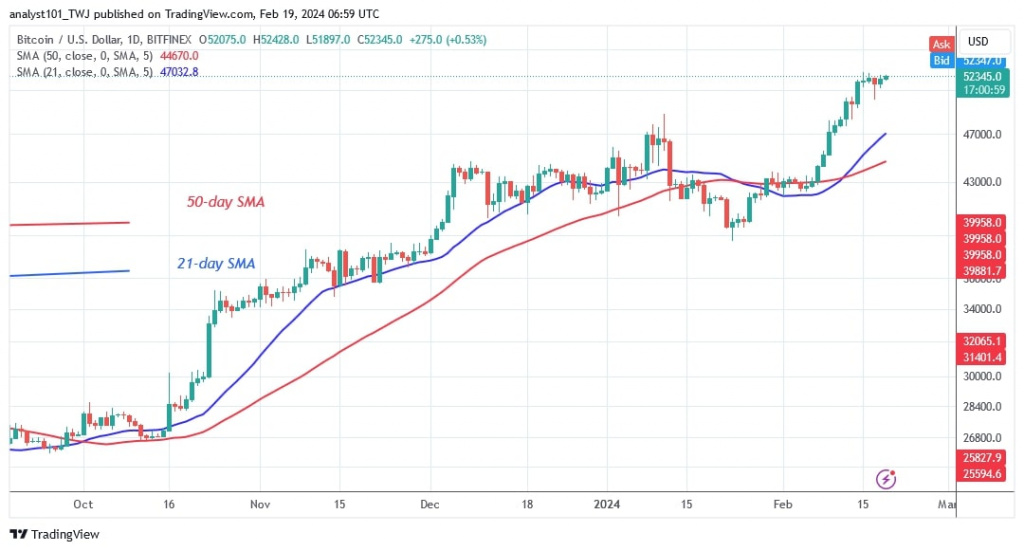
The current uptrend is encountering resistance near the $53,000 high. The price of the cryptocurrency is oscillating below its recent high in anticipation of further upward movement. Bitcoin price reached $52,298.
Now, if the support level of $52,000 holds, the uptrend of the largest cryptocurrency will resume. A price rise above the existing support will break through the resistance at $53,000. The positive momentum will continue up to the high of $60,000.
Nevertheless, the cryptocurrency traded in a price range of $50,000 to $53,000. The price movement was slowed down by the appearance of doji candlesticks. Bitcoin risks a decline if the $50,000 support is broken. Bitcoin will first fall above the 21-day SMA or above the $47,000 low.
Bitcoin indicator reading
Bitcoin price bars have continued to rise above the moving average lines. Currently, the rising trend has paused below the $53,000 level. The trend will stop when the price bars fall below the moving average lines. In the meantime, Bitcoin is trading slightly below its recent high.
Technical indicators:
Key resistance levels – $55,000 and $60,000
Key support levels – $45,000 and $40,000
What is the next direction for BTC/USD?
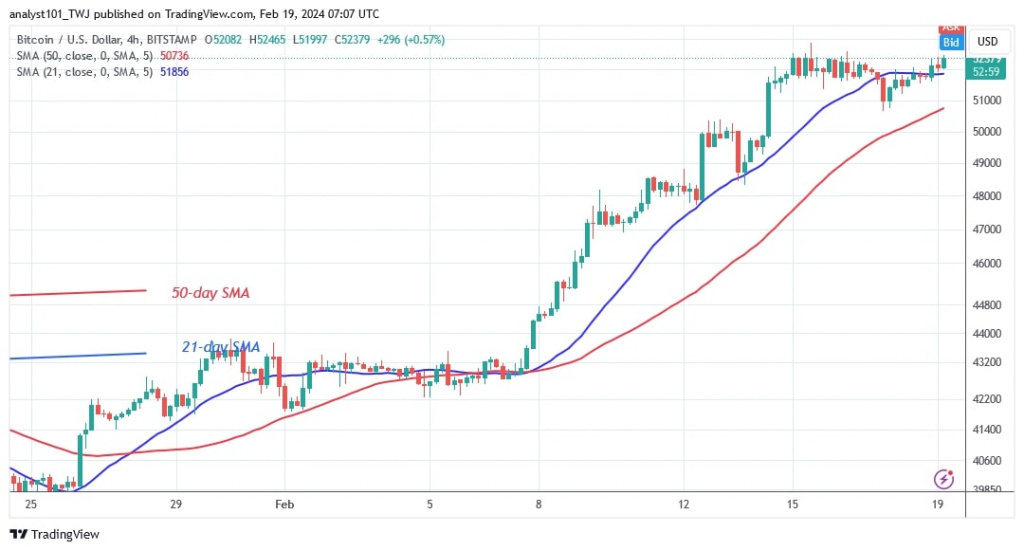
On the 4-hour chart, Bitcoin is trading sideways between $50,000 and $53,000. The bullish rally has ended and Bitcoin has resumed a range-bound move in anticipation of a trend. The cryptocurrency value is stabilizing above the $52,000 support but below the $53,000 resistance level. Cryptocurrencies will trend when the support and resistance levels are breached.

Disclaimer. This analysis and forecast are the personal opinions of the author and are not a recommendation to buy or sell cryptocurrency and should not be viewed as an endorsement by CoinIdol.com. Readers should do their research before investing in funds.


