The price of Bitcoin (BTC) has fallen to $66,680, but remains above its 21-day moving average. The largest cryptocurrency was on the verge of a recovery or a collapse.
Long-term forecast for the Bitcoin price: bullish
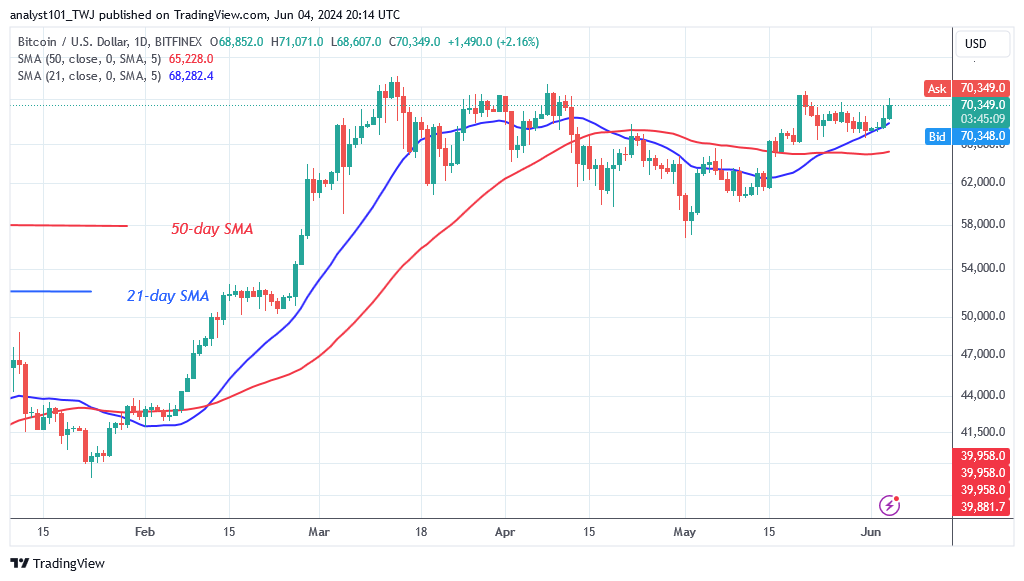
Bitcoin rose sharply on June 3, reaching the psychological price level of $70,000. Prior to this, the Bitcoin price moved in a range of $66,400 to $70,000. On May 31, the bears pushed Bitcoin to a low of $66,800 and attempted to break the 21-day SMA support. Bitcoin recovered and reached its previous high of $71,071. The cryptocurrency is currently worth $70,378.
On the upside, Bitcoin will rise to $75,000 if the current barrier of $70,000 is broken. It is currently trading above the 21-day SMA or the $68,400 support but below the psychological price level of $70,000.
Bitcoin indicator reading
After a near breakout, Bitcoin recovered above the 21-day SMA support. Since May 15, buyers have kept Bitcoin above its moving average lines. The cryptocurrency resumes its uptrend above the moving average lines. However, if the bears break below the moving average lines, the upside momentum will stop.
Technical indicators:
Key resistance levels – $70,000 and $80,000
Key support levels – $50,000 and $40,000
What is the next direction for BTC/USD?
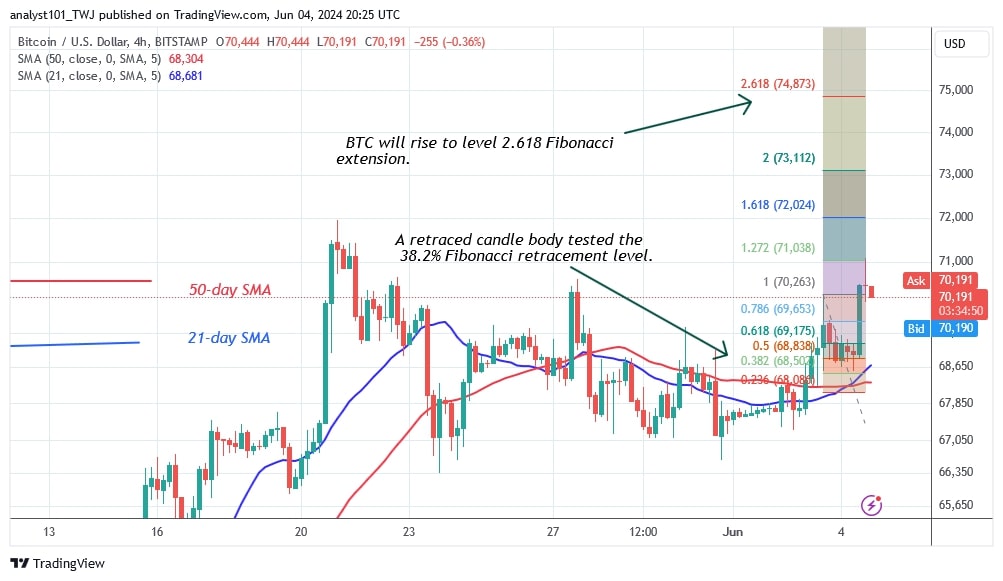
Bitcoin has rallied and is trying to surpass its previous high of $71,922. During the current rally, the Bitcoin price is stuck below $71,000. During the rally on June 3, a candlestick body tested the 38.2% Fibonacci retracement line. The retracement predicts that Bitcoin will rise to the 2,618 Fibonacci extension level, which is at $74,873.

Disclaimer. This analysis and forecast are the personal opinions of the author and are not a recommendation to buy or sell cryptocurrency and should not be viewed as an endorsement by CoinIdol.com. Readers should do their research before investing in funds.


