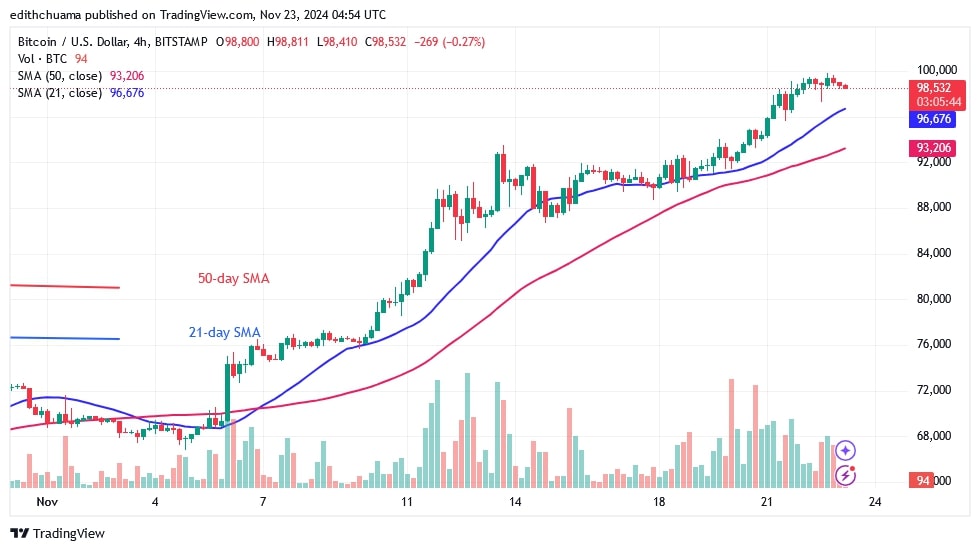
The price of Bitcoin (BTC) has risen to the psychological milestone of $100,000. BTC price analysis by Coinidol.com.
Bitcoin price long-term forecast: bullish
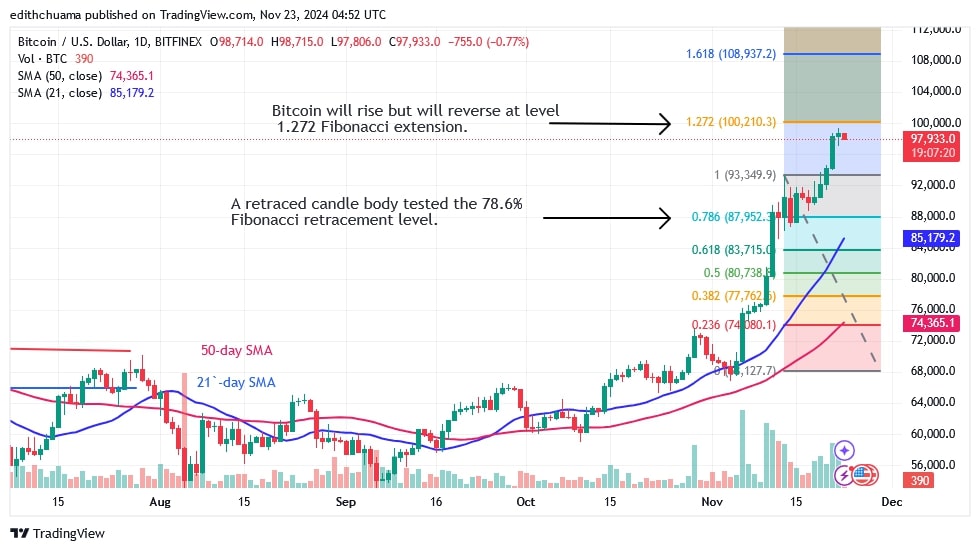
On November 22, the Bitcoin price reached a high of $99,800 before falling back. The cryptocurrency has stalled below the $100,000 resistance level but is consolidating above the $98,000 support.
On November 22, the candle shows a pronounced tail, signaling significant buying pressure at the current support. If the bulls hold their positions, the cryptocurrency could rise even further. Bitcoin will continue to rise if buyers hold the $93,000 breakout level and breach the $100,000 mark. Bitcoin will rise to a high of $115,000.
In contrast, Bitcoin will fall if the bears drop below the $93,000 support level. The cryptocurrency value will fall to a low above the 21-day SMA or a low of $85,240. In the meantime, Bitcoin is currently worth $98,200.
Bitcoin indicator reading
Bitcoin has stalled after rising to a high of $99,800. Doji, or miniature indecision candles, have emerged. These candlesticks show that traders have reached a point of hesitation as Bitcoin stops below its recent high. The 21-day SMA supports the cryptocurrency’s uptrend.
Technical indicators:
Resistance Levels – $80,000 and $100,000
Support Levels – $70,000 and $50,000
Which cryptocurrency leg for BTC/USD?
On the 4-hour chart, Bitcoin is on a gentle rise after breaking through the $93,000 resistance. Since the breakout, the cryptocurrency has traded moderately due to the doji candlesticks. Bitcoin is trading above the 21-day SMA as the market continues its uptrend.

Disclaimer. This analysis and forecast are the personal opinions of the author. They are not a recommendation to buy or sell cryptocurrency and should not be viewed as an endorsement by CoinIdol.com. Readers should do their research before investing in funds.


