Bitcoin (BTC) price plummets after failing to hold above the crucial 21-day SMA support.
Long-term forecast for the Bitcoin price: bullish
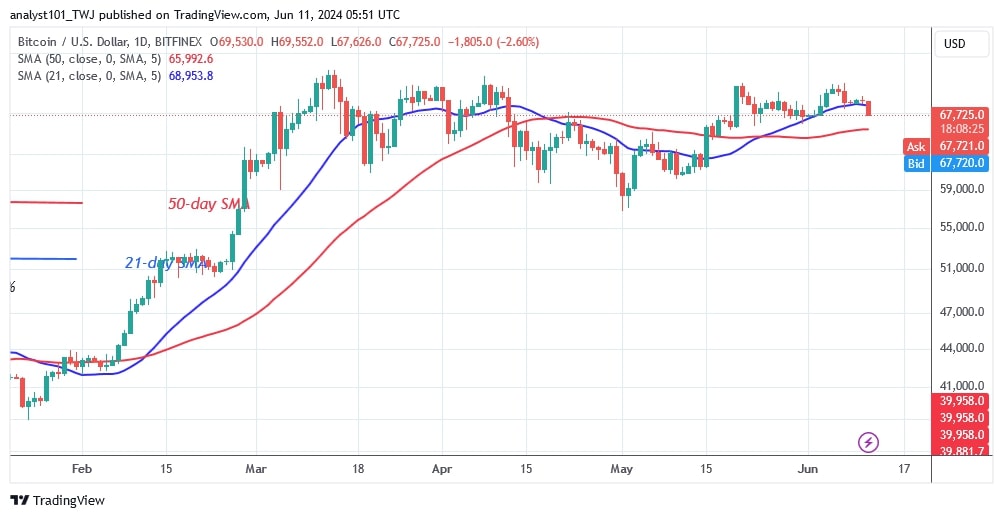
So far, the largest cryptocurrency has failed to break above the $72,000 resistance level. The bulls were beaten back twice when they tried to overcome the resistance level. A break above the $72,000 mark would have pushed the cryptocurrency to the psychological price level of $80,000. On the downside, Bitcoin is likely to fall if the bears break below the 21-day SMA support.
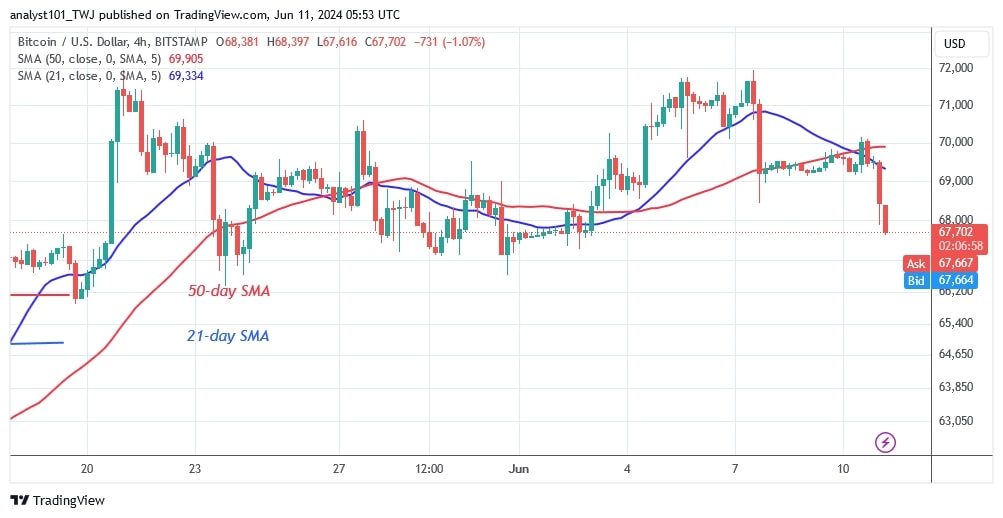
According to price analysis by Coinidol.com, on the downside, the price of the cryptocurrency has broken below the 21-day SMA and the negative momentum is expected to make a low at the 50-day SMA support. In other words, Bitcoin is expected to fall to a price of $66,000. The cryptocurrency is expected to trade in a range where it finds support above the 50-day moving average. At the time of writing, the value of Bitcoin stands at $67,641.
Bitcoin indicator reading
Following Bitcoin’s recent plunge, the cryptocurrency is trapped between the moving average lines. The cryptocurrency value will trade between the 21-day and 50-day SMA until the moving average lines are breached. Despite Bitcoin’s decline, the moving average lines are horizontal.
Technical indicators:
Key resistance levels – $70,000 and $80,000
Key support levels – $50,000 and $40,000
What is the next direction for BTC/USD?
Bitcoin is bearish on the 4-hour chart and trending sideways. BTC is falling towards its current support at $67,105. The current support has been holding since May 23, 2024. If the current support is broken, the Bitcoin price will fall to the projected price level of $66,000.

Disclaimer. This analysis and forecast are the personal opinions of the author and are not a recommendation to buy or sell cryptocurrency and should not be viewed as an endorsement by CoinIdol.com. Readers should do their research before investing in funds.


