


- Bitcoin price shows a massive drop in volatility as it consolidates around the $30,000 psychological level.
- A potential distribution pattern is brewing and could trigger an 8.66% pullback.
- A decisive candlestick close above $31,500 that flips it into a support level will invalidate the bearish thesis.
Bitcoin price has been trading in a tight range for nearly two weeks now with no signs of resolution. But a closer look at the price action reveals a potential distribution pattern that could trigger a sharp correction soon.
Read more: Will Bitcoin price face negative effects from Federal Reserve’s two rate hikes?
Bitcoin price needs to reset
Bitcoin price shows a clear Wyckoff distribution pattern formed on the two-hour chart, as shown below. The setup has a few distinctive parts to it; the local top formed on June 21 is the Primary Supply (PS), where the selling occurred.
Following the formation of an initial supply, the bulls pushed Bitcoin price to form a Buy Climax (BC). As investors book profits after this uptick, it led to a pullback that formed an Automatic Reaction (AR).
A failed attempt at another rally leads to the formation of a Secondary Test (ST). Likewise, a failed sell-off now forms a Sign of Weakness (SOW). What follows next is a classic sign of manipulation or trapping of early bulls due to the Upthrust (UT) above the buying climax. This phase is followed by UTAD (Upthrust after distribution), which are two places where smart money offloads their holdings.
Hence, after UTAD, the asset undergoes a steep correction.
As Bitcoin price trades around $30,822, investors need to be aware of two scenarios – a sudden sell-off from the current position or a sweep of the $31,500 high followed by a correction. In both situations, the target for bears includes $28,138, which is the midpoint of the 27% rally seen between June 15 and 23.
In some cases, the downswing could push Bitcoin price to tag the 62% retracement level at $27,331 or the 70% retracement level at $26,760.
In total, investors can expect BTC to drop anywhere between 8.66% to 15% in the coming days.
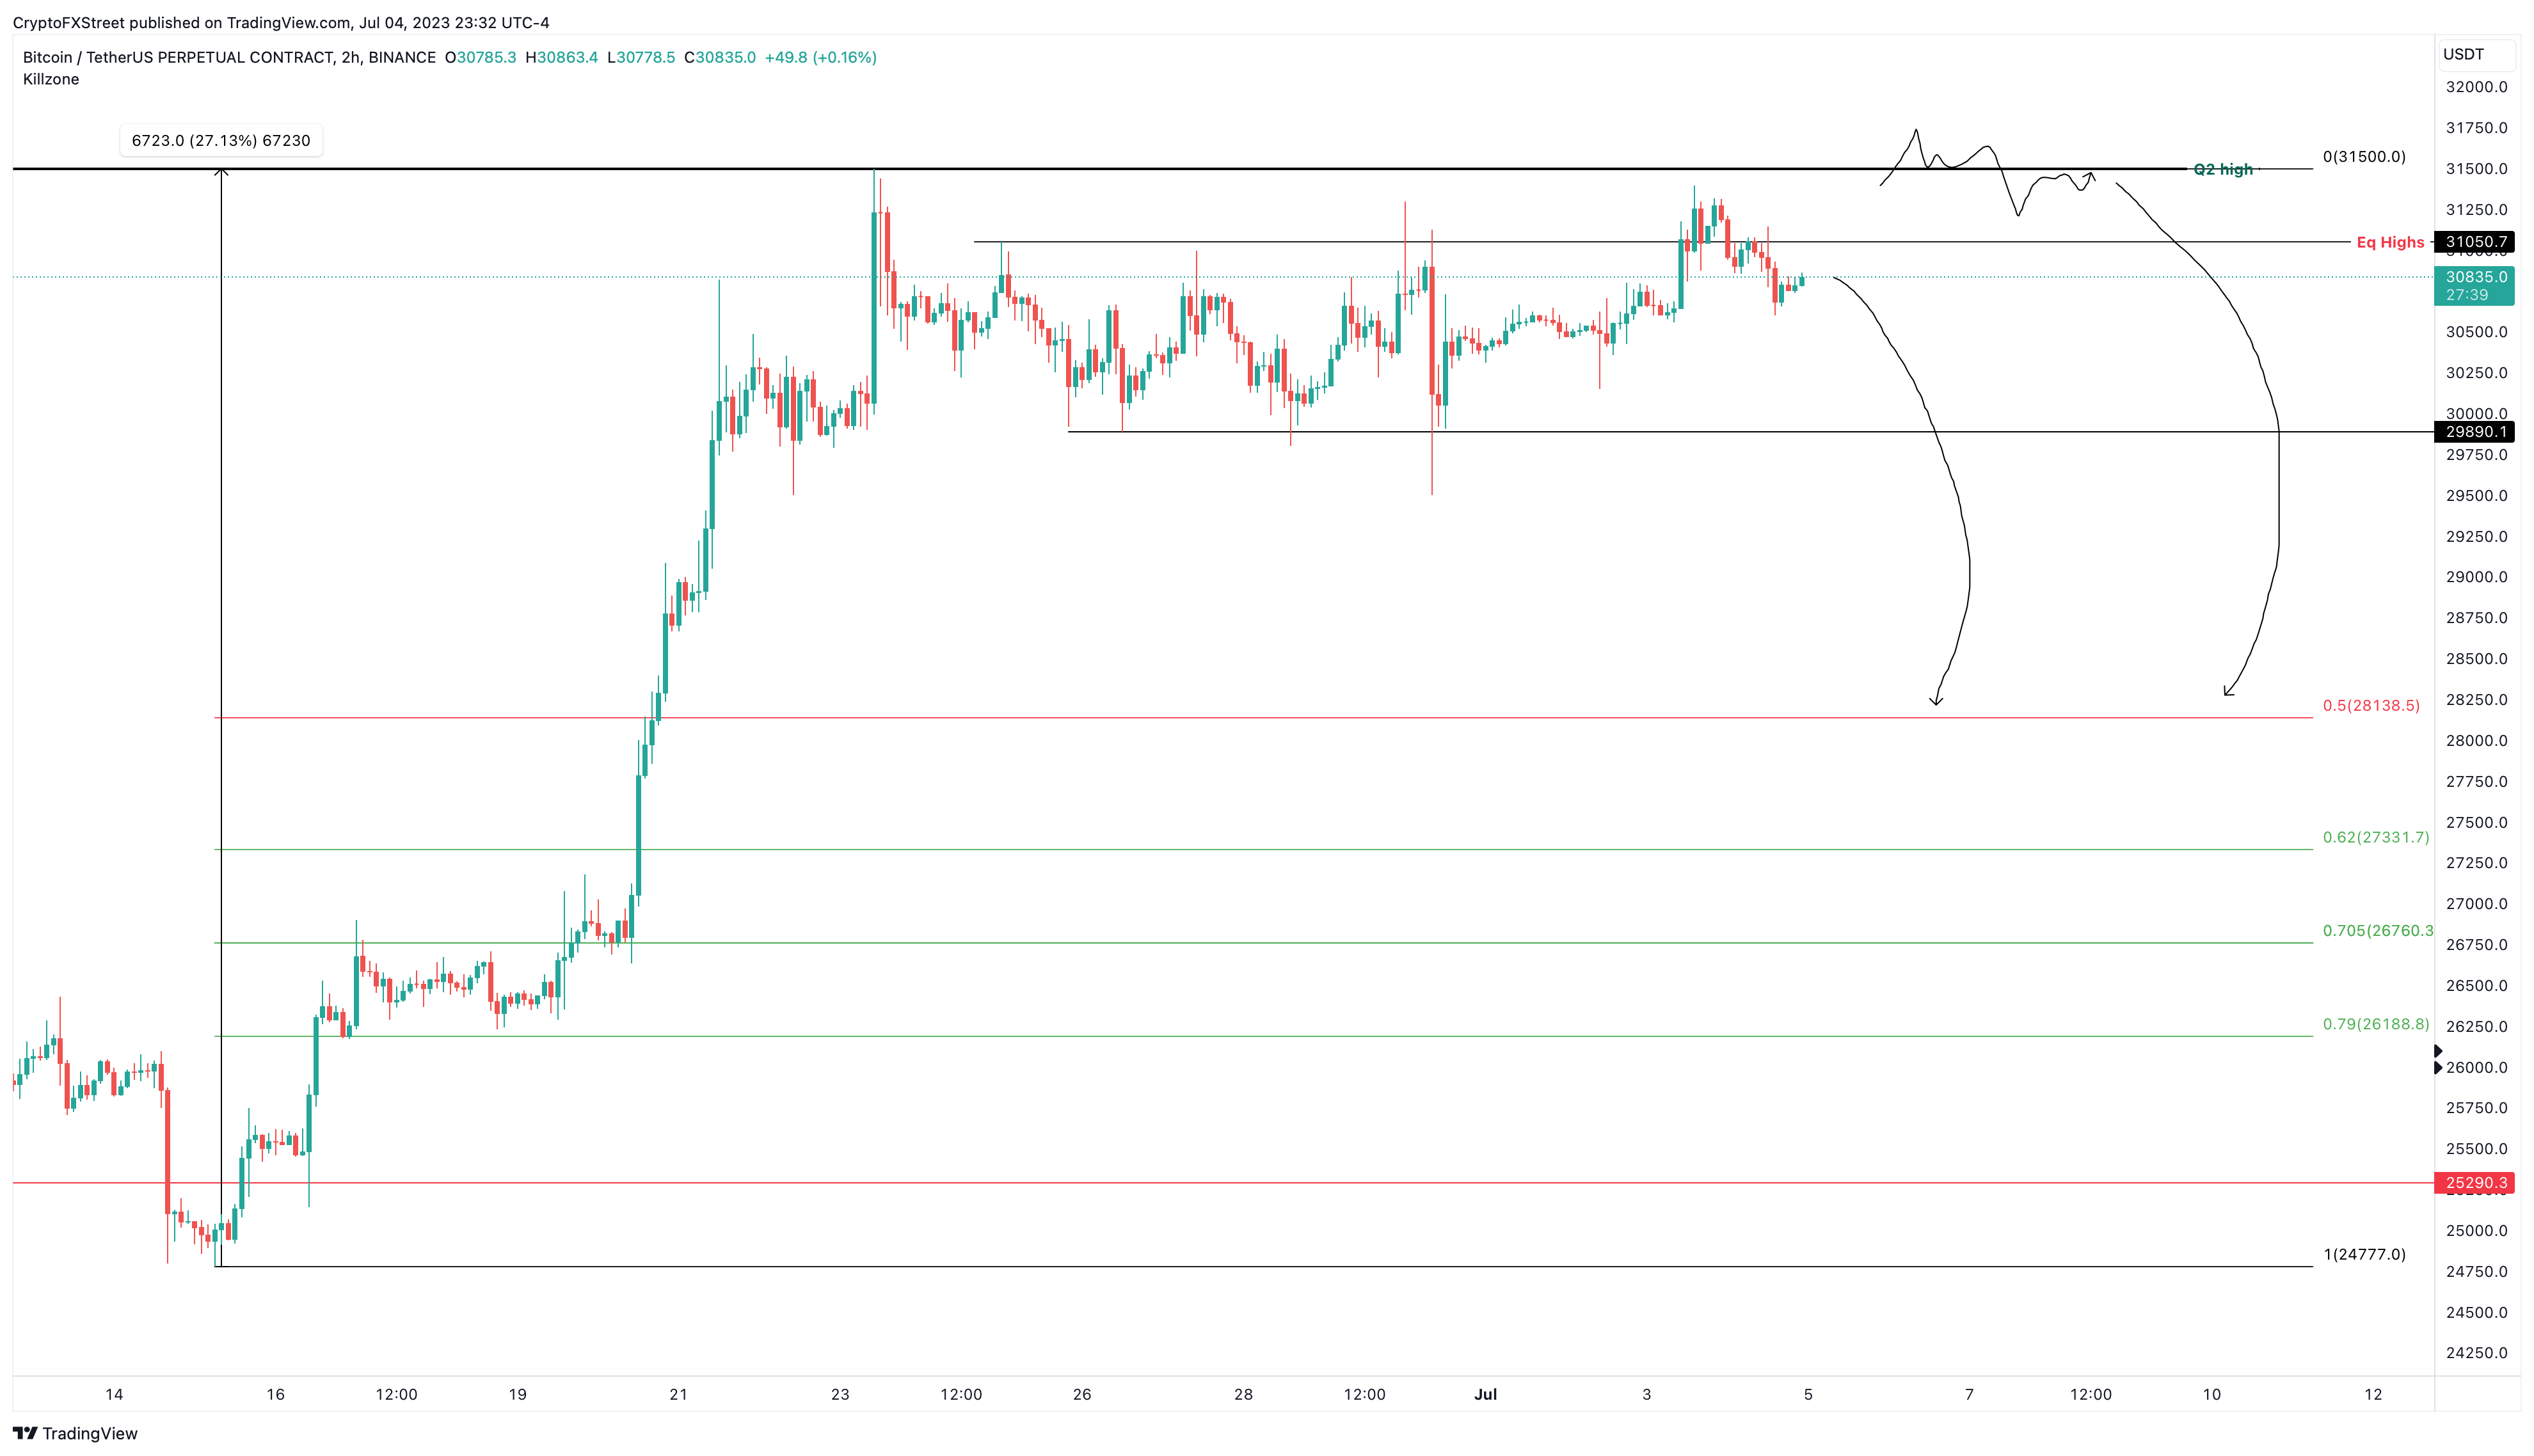
BTC/USDT 2-hour chart
While the technical outlook for Bitcoin price makes sense, further backing is obtained by looking at Santiment’s 30-day Market Value to Realized Value (MVRV) model. This indicator is used to track the average profit/loss of investors that purchased BTC over the last month. A positive value indicates that these holders are in profit and could lead to a sell-off if these gains are realized.
Looking at the history, a spike in the 30-day MVRV to certain levels leads to a correction in the underlying asset’s price. These levels are termed “danger zones” and change depending on the asset and the market phases.
For Bitcoin price, history shows that the danger zone lies above 10% and leads to the formation of local tops and corrections. Additionally, if divergences occur between the MVRV and price in the danger zones, it increases the odds of a sell-off.
Divergence is when the indicator and the price movement are not in line. In this case, a bearish divergence is when the MVRV produces a lower low, indicating that investors are booking profits, but the price climbs, producing higher highs. Such a non-conformity often leads to sharp nosedives in the underlying asset’s market value.
As seen in the chart below, the last bearish divergence in the danger zone was formed on August 14, 2022, and triggered a 26% correction in the next 23 days. The ongoing bearish divergence, however, could lead to a decent pullback that extends anywhere between 8.66% to 15%, as detailed above.
%20%5B07.06.31,%2005%20Jul,%202023%5D-638241247729014103.png "Bitcoin price stalls at $31,500, putting short-term BTC trader gains in jeopardy 2")
BTC MVRV 30-day chart
Also read: Three reasons why Bitcoin’s 2023 rally is just starting
Despite strong proof that a sell-off in Bitcoin price is likely, investors need to be cautious of a fluke rally that catches bears off guard. If BTC produces a decisive flip of the $31,500 hurdle into a support floor on a higher timeframe, it will invalidate the bullish thesis.
This move would also set up a higher high and attract sidelined buyers, triggering a leg up to the next key level at $35,000.


")
