The price of Bitcoin (BTC) is falling again as buyers have failed to keep the price above the moving average lines. Price analysis by Coinidol.com.
Bitcoin price long-term forecast: bearish
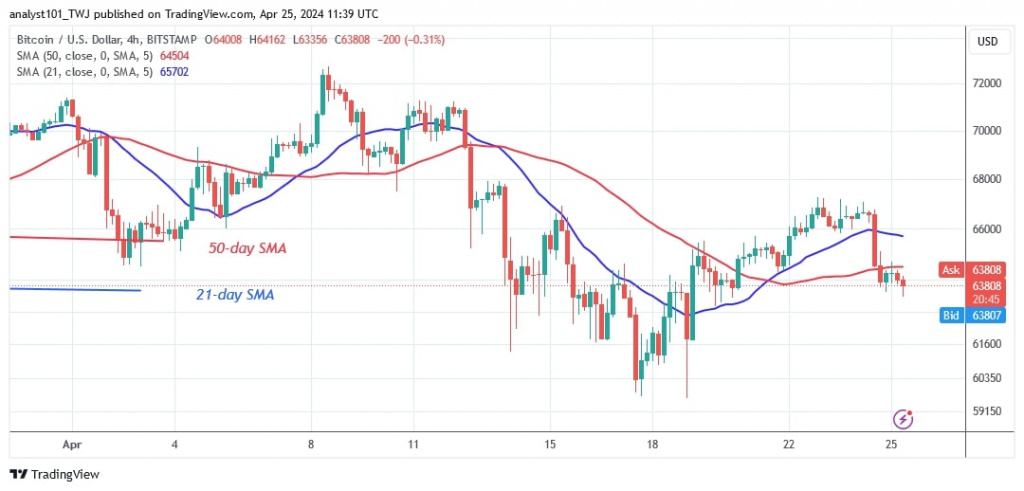
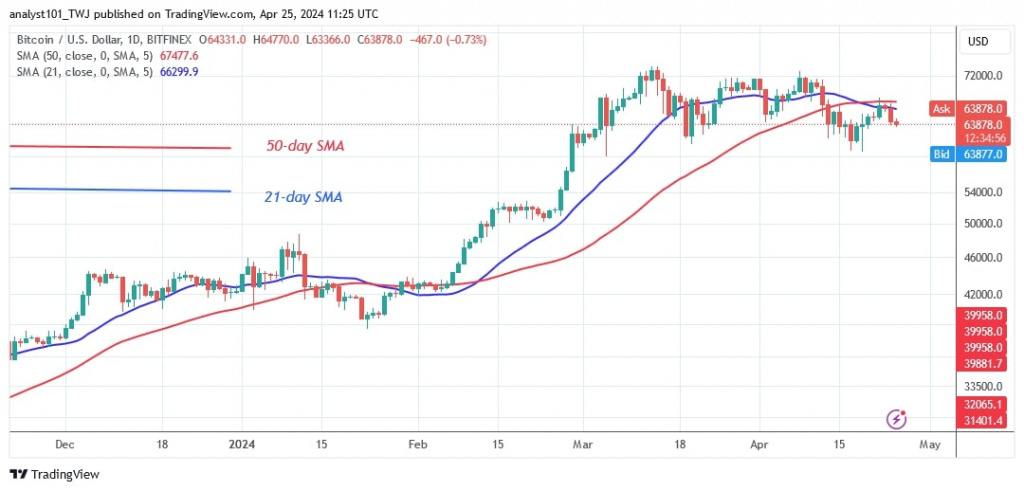
On April 22, 2024, the positive momentum surpassed the 21-day SMA but was halted by the 50-day SMA or the $68,500 resistance level. If the buyers had prevailed, Bitcoin would have reached its all-time high of $73,666. Bitcoin is in a downtrend after failing to break above the moving averages. The cryptocurrency is bearish as it approaches the current support level of $63,000. On April 17, 2024, the price decline was halted above $60,900 as bulls bought dips. At the time of writing, the value of Bitcoin stands at $63,801.
On the downside, if Bitcoin retraces and remains above current levels, it will be forced to trade in a range between the $60,900 support and below the moving average lines. However, if the bears break the $60,900 support, Bitcoin would drop to a low of $54,000.
Bitcoin indicator reading
The BTC price bars are below the moving average lines, indicating a possible decline. Similarly, BTC price is showing a bearish crossover, with the 21-day SMA falling below the 50-day SMA, suggesting that the cryptocurrency could crash.
Technical indicators:
Key resistance levels – $70,000 and $80,000
Key support levels – $50,000 and $40,000
What is the next direction for BTC/USD?
Bitcoin’s rise would have resumed on April 22, 2024 if buyers had kept the price above the moving averages. Bitcoin is expected to fall or stay within its current range. Bitcoin is trading in the middle of its price range of $60,900 to $67,000.

Disclaimer. This analysis and forecast are the personal opinions of the author and are not a recommendation to buy or sell cryptocurrency and should not be viewed as an endorsement by CoinIdol.com. Readers should do their research before investing in funds.


