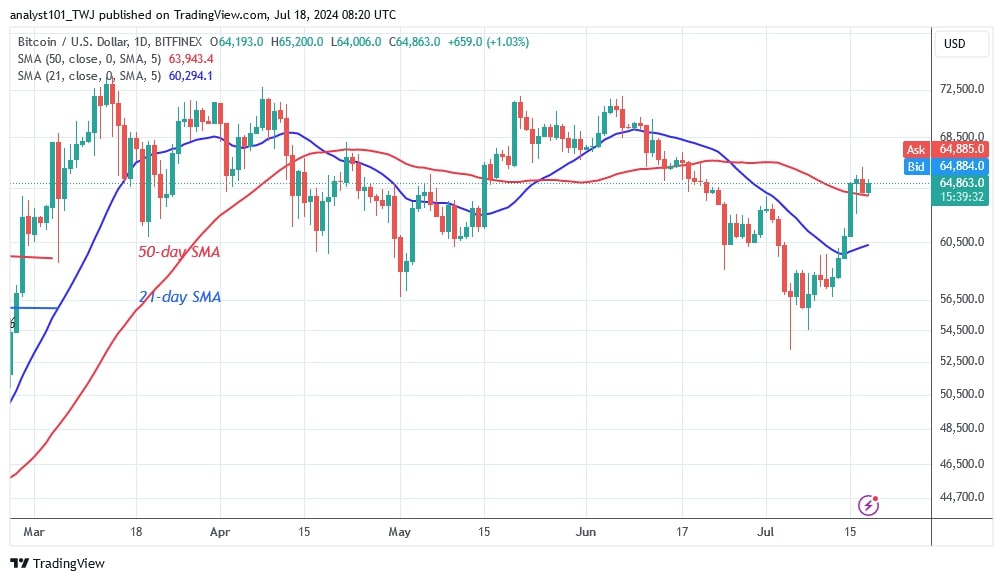
The price of Bitcoin (BTC) rose above the moving average lines on July 15. The positive trend persisted as the price of the cryptocurrency held above the 50-day SMA after a minor correction.
Bitcoin price long-term prediction: bullish
Today, the largest cryptocurrency begins a likely rise, reaching a high of $64,782. If buyers maintain their positive momentum, Bitcoin will continue to rise and reach its previous high of $70,000 again. Furthermore, Bitcoin will rise if the price bars remain above the moving average lines.
Moreover, the upside momentum will hit an initial roadblock near the $66,180 level. However, the bears will try to pull the decline to the previous low above the 21-day SMA support if Bitcoin price falls below the 50-day SMA support. In other words, Bitcoin will fall and remain range-bound between the moving average lines.
Bitcoin indicators reading
After the recent price increase, the BTC price bars are above the moving average lines. The bulls and bears are battling above the 50-day SMA as Bitcoin approaches a first barrier at $66,180. Bitcoin will resume its uptrend if it breaks through the first barrier.
Technical indicators:
Key Resistance Levels – $70,000 and $80,000
Key Support Levels – $50,000 and $40,000

What is the next direction for BTC/USD?
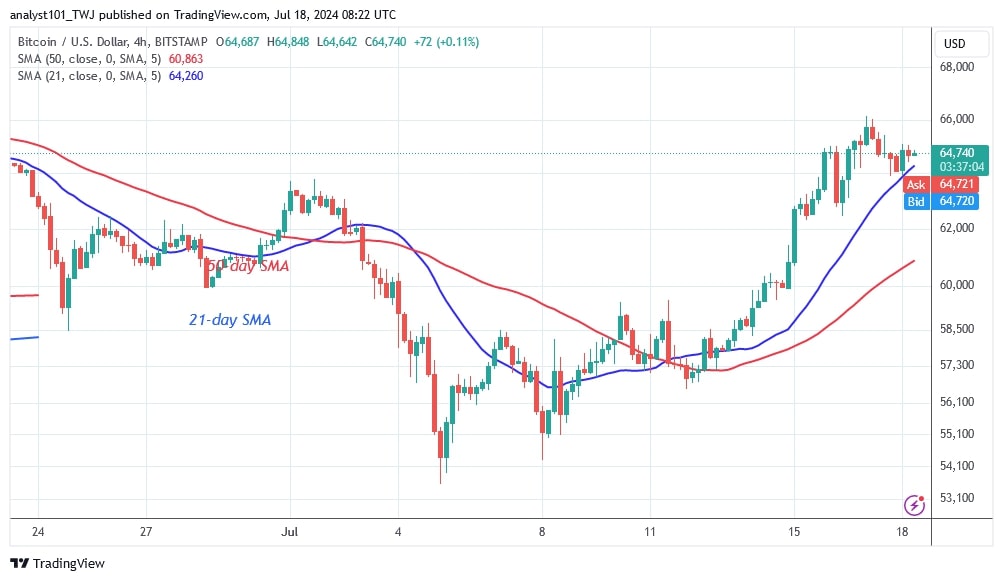
The largest cryptocurrency is on track to retest the psychological price barrier of $70,000. On the 4-hour chart, Bitcoin is above the 21-day SMA support but below the $66,000 barrier. The cryptocurrency will start an uptrend if it breaks the $66,000 barrier. Should the bears break the 21-day SMA support, the value of the cryptocurrency would decline. This would force the cryptocurrency to fall to its previous low of $60,500.

Disclaimer. This analysis and forecast are the personal opinions of the author. They are not a recommendation to buy or sell cryptocurrency and should not be viewed as an endorsement by CoinIdol.com. Readers should do their research before investing in funds.


