Bitcoin (BTC) has fallen below the moving average lines after rejecting the 50-day SMA. Price analysis by Coinidol.com.
Long-term forecast for the Bitcoin price: bearish
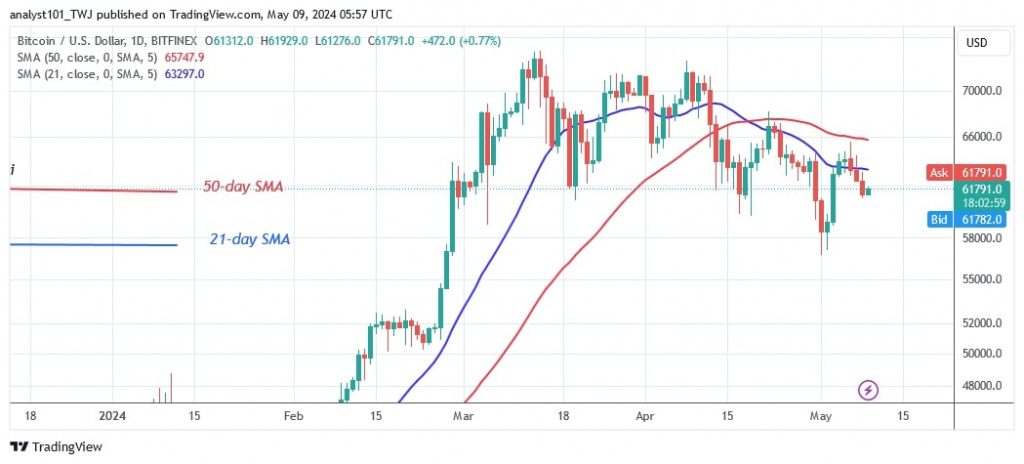
Since its rejection on April 8, 2024, the price of the cryptocurrency has followed a pattern of lower highs and lower lows. In other words, Bitcoin fell from a high of $72,762 to a low of $56,711 as the bulls bought the dips.
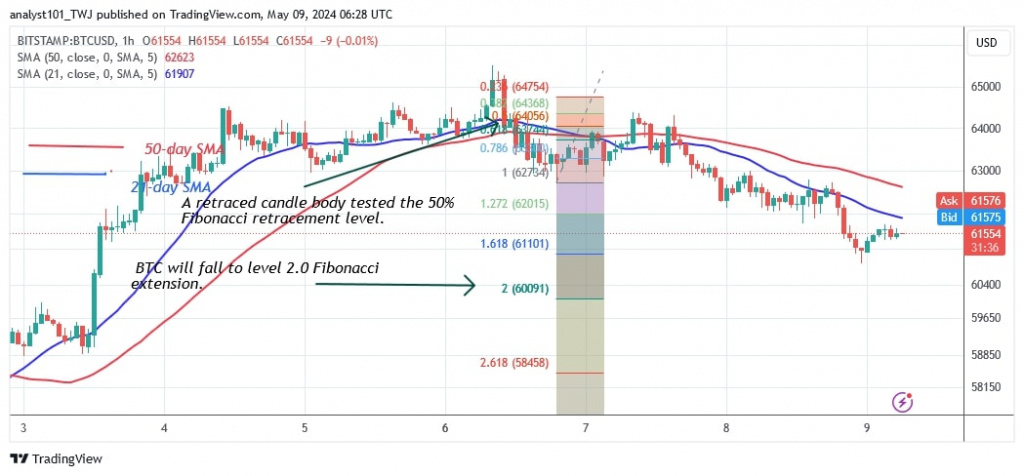
On May 1, the bulls bought the dips and rallied to a high of $65,628. The bullish momentum broke through the 21-day SMA but was halted at the 50-day SMA. Bitcoin has fallen below the moving average lines today and could fall even further to its previous low. At the time of writing, the BTC/USD price stands at $61,929. Should the bears break the current support of $60,914, Bitcoin would fall to its previous low of $56,711.
Bitcoin indicator reading
The 21-day and 50-day SMAs are horizontally sloped and follow the sideways trend pattern. The 21-day SMA, which serves as a resistance line, has put the brakes on the cryptocurrency’s potential upside moves. Bitcoin will continue to fall as long as the price bars remain below the moving average lines.
Technical indicators:
Key resistance levels – $70,000 and $80,000
Key support levels – $50,000 and $40,000
What is the next direction for BTC/USD?
Bitcoin is in a downtrend after the recent rejection. Should the bears break through the $60,914 support, the cryptocurrency would drop to a low of $58,500.
Meanwhile, the price indicator suggests that Bitcoin could fall much further to its previous level. During the price decline on May 6, a candlestick body approached the 50% Fibonacci retracement level. The retracement suggests that Bitcoin will fall to the level of the 2.0 Fibonacci extension or $60,091.

Disclaimer. This analysis and forecast are the personal opinions of the author and are not a recommendation to buy or sell cryptocurrency and should not be viewed as an endorsement by CoinIdol.com. Readers should do their research before investing in funds.


