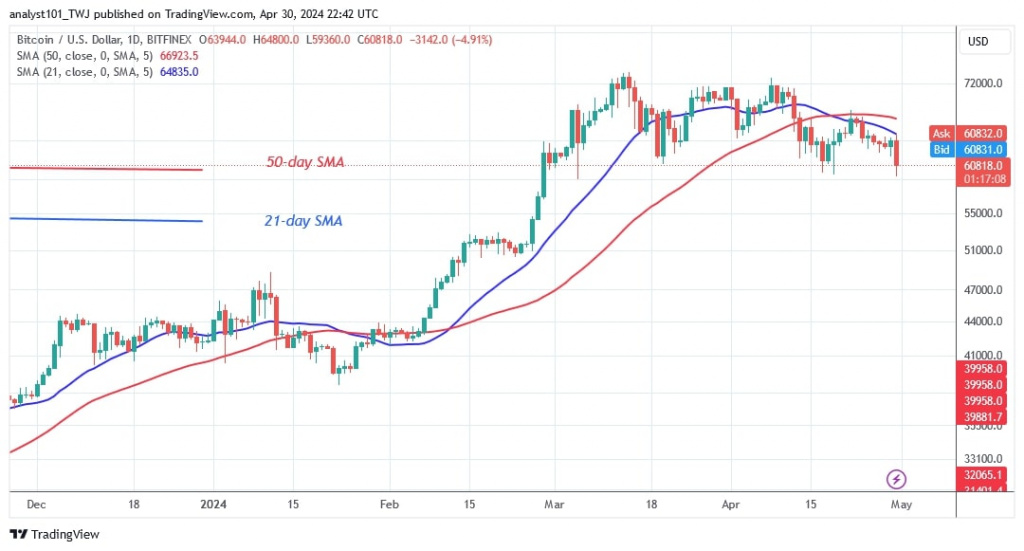
The price of Bitcoin (BTC) has fallen steadily and reached its historic low on April 17, 2024. Now the largest cryptocurrency has dropped to a low of $57,729 before its uptrend.
Long-term forecast for the Bitcoin price: bearish
The moving average lines and resistance at $68,000 have further slowed the upward movement. A further upward movement to the high of $73,666 seems unlikely.
On the downside, the Bitcoin price retested the previous low of $59,810 before pulling back. However, if the previous low holds, Bitcoin will continue to range between the support at $59,810 and below the moving average lines. If, on the other hand, the current support is broken, the largest cryptocurrency will fall to $54,200. Meanwhile, the value of Bitcoin stands at $60,128.
Bitcoin indicator reading
The moving average lines are horizontal, indicating a sideways trend. BTC will continue to fall as long as the price bars remain below the moving average lines. In addition, the cryptocurrency has bearish crossovers on both charts.
Technical indicators:
Key resistance levels – $70,000 and $80,000
Key support levels – $50,000 and $40,000
What is the next direction for BTC/USD?
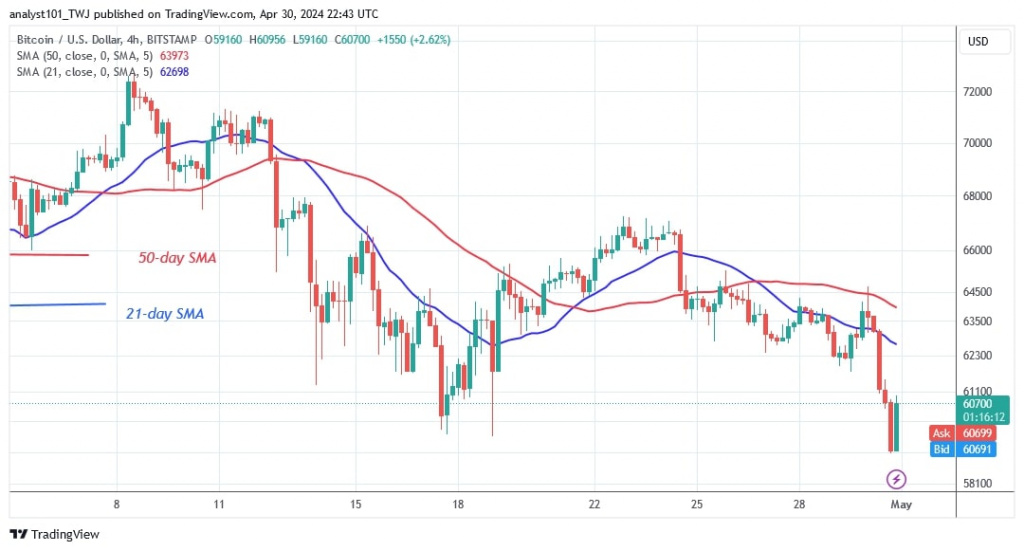
On the 4-hour chart, Bitcoin is in decline below the current price range. In recent prices, Bitcoin has been trading between $60,000 and $66,000. Today, the bears have broken and retested the current support as Bitcoin prepares for a further decline. Today, the cryptocurrency has fallen further to the low of $57,600.

Disclaimer. This analysis and forecast are the personal opinions of the author and are not a recommendation to buy or sell cryptocurrency and should not be viewed as an endorsement by CoinIdol.com. Readers should do their research before investing in funds.


