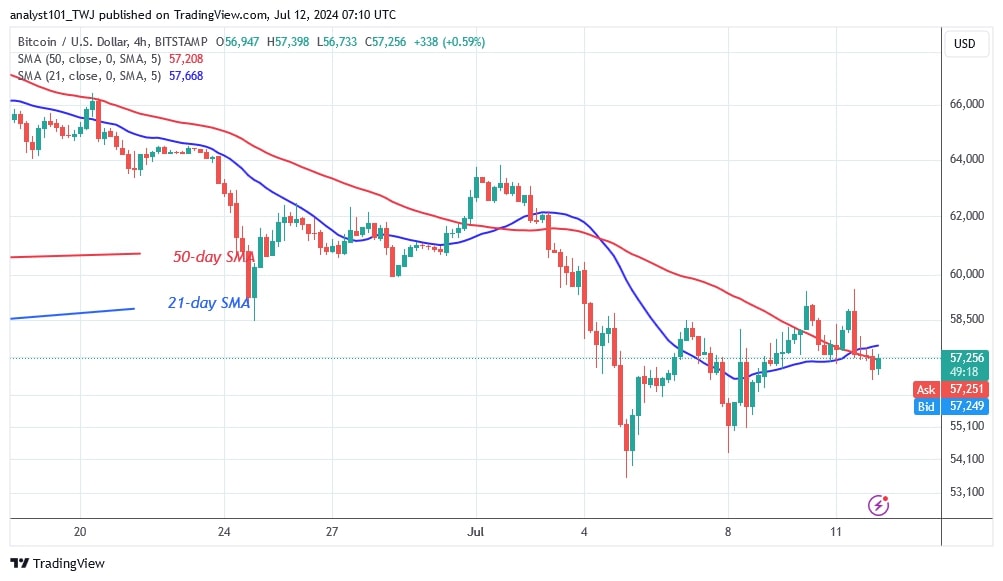
The Bitcoin (BTC) price has halted its decline above the $55,000 support after hitting the lows of $53,219 and $54,500.
Long-term forecast for the Bitcoin price: bearish
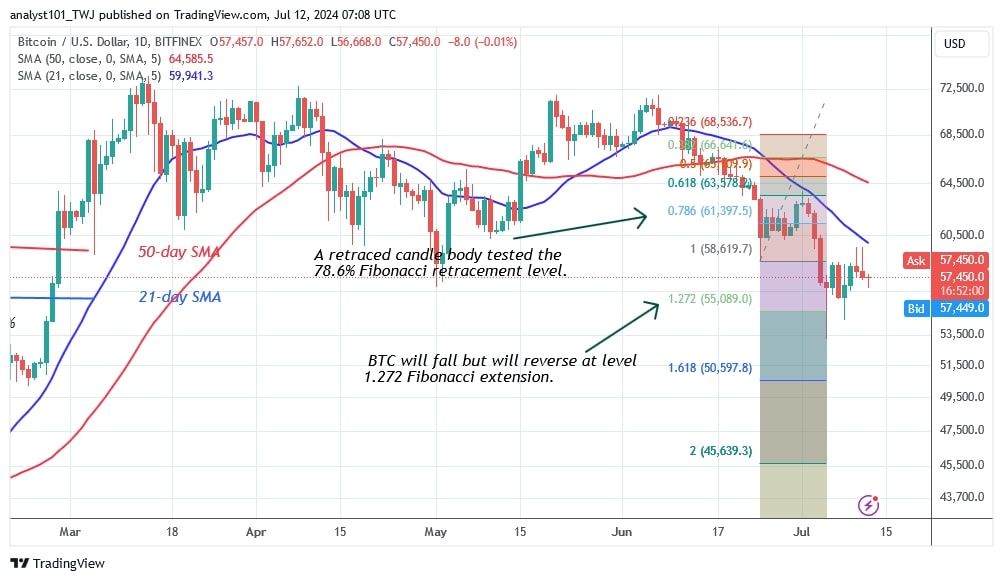
BTC is forced to trade in a range above the $54,000 support but below the resistance at the $60,000 high or the 21-day moving averages. On July 10 and 11, buyers were pushed back as they tried to hold price above the 21-day SMA. The bullish momentum will continue until it reaches the 50-day SMA high or $64.590.
However, Bitcoin has fallen after a rejection of the $60,000 high on July 11. Should the bears break the support at $54,000, Bitcoin will fall and retest the psychological price barrier of $50,000. In the meantime, according to the report by Coinidol.com, it is valued at $57,241.
Bitcoin indicator reading
The risks related to Bitcoin are increasing as the price bars on both charts are below the moving average lines. The 21-day SMA limits the further upside of the Bitcoin price. Doji candlesticks emerge as Bitcoin falls slightly.
Technical indicators:
Key resistance levels – $70,000 and $80,000
Key support levels – $50,000 and $40,000
What is the next direction for BTC/USD?
Bitcoin is trading in a range after the end of the downtrend on July 5 and 8. However, the selling pressure has not abated as Bitcoin has encountered another rejection at the $60,000 high. The decline has stalled in the middle of the price range, with Bitcoin consolidating above the $57,000 support. According to the price indicator, Bitcoin will reverse above the $55,000 level.

Coinidol.com reported on July 7 that the largest cryptocurrency has fallen to $53,219, below the crucial support of $60,000 and the previous low of $58,555.
Disclaimer. This analysis and forecast are the personal opinions of the author. They are not a recommendation to buy or sell cryptocurrency and should not be viewed as an endorsement by CoinIdol.com. Readers should do their research before investing in funds.


